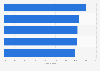
This statistic illustrates the share of Americans who went bowling in the last 12 months as of 2018, by age. In that year, 20.72 percent of respondents aged 18 to 29 years stated that they went bowling in the last 12 months.
Share of Americans who went bowling in the last 12 months in 2018, by age
Profit from the additional features of your individual account
Currently, you are using a shared account. To use individual functions (e.g., mark statistics as favourites, set
statistic alerts) please log in with your personal account.
If you are an admin, please authenticate by logging in again.
Learn more about how Statista can support your business.
Statista. (October 31, 2018). Share of Americans who went bowling in the last 12 months in 2018, by age [Graph]. In Statista. Retrieved May 09, 2025, from https://www.statista.com/statistics/227416/number-of-bowling-players-usa/
Statista. "Share of Americans who went bowling in the last 12 months in 2018, by age." Chart. October 31, 2018. Statista. Accessed May 09, 2025. https://www.statista.com/statistics/227416/number-of-bowling-players-usa/
Statista. (2018). Share of Americans who went bowling in the last 12 months in 2018, by age. Statista. Statista Inc.. Accessed: May 09, 2025. https://www.statista.com/statistics/227416/number-of-bowling-players-usa/
Statista. "Share of Americans Who Went Bowling in The Last 12 Months in 2018, by Age." Statista, Statista Inc., 31 Oct 2018, https://www.statista.com/statistics/227416/number-of-bowling-players-usa/
Statista, Share of Americans who went bowling in the last 12 months in 2018, by age Statista, https://www.statista.com/statistics/227416/number-of-bowling-players-usa/ (last visited May 09, 2025)
Share of Americans who went bowling in the last 12 months in 2018, by age [Graph], Statista, October 31, 2018. [Online]. Available: https://www.statista.com/statistics/227416/number-of-bowling-players-usa/