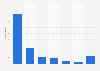
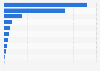
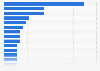

Robbery rate in the U.S. 2023, by state
The District of Columbia had the highest robbery rate in the United States in 2023, with 614.2 robberies per 100,000 inhabitants. The lowest robbery rate in the country was found in Idaho, with 9.5 robberies per 100,000 inhabitants.
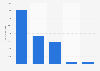
Crime in the District of Columbia
The violent crime rate in the District of Columbia was found to be the highest in the United States, with there being a few reasons for this: Firstly, the population of the District of Columbia is quite low (causing a higher rate of crime), and secondly, issues such as the crack epidemic of the 1990s exacerbated the prevalence of crime in the District. As rising rents and gentrification force more people out of the District, crime is moving into neighboring Maryland and Virginia suburbs, as poorer residents seek more affordable living conditions.
Crime in the United States
Overall, violent crime in the United States and the District of Columbia today is far below the violent crime rate of the 1990s. While some may feel that crime is on the rise, due in part to media sensationalism in fact, the opposite is true, and the United States is becoming safer over time.