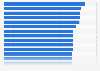
In 2023, the real median household income in the state of Alabama was 60,660 U.S. dollars. The state with the highest median household income was Massachusetts, which was 106,500 U.S. dollars in 2023. The average median household income in the United States was at 80,610 U.S. dollars.
Median household income in the United States in 2023, by state
(in 2023 U.S. dollars)
You have no right to use this feature.
Make sure to contact us if you are interested in scientific citation.
You can upgrade your account to enable this functionality for all statistics.
This feature is not available with your current account.Request access
Medians are calculated using 2,500 U.S. dollars income intervals. Beginning with 2009 income data, the Census Bureau expanded the upper income intervals used to calculate medians to 250,000 U.S. dollars or more. Medians falling in the upper open-ended interval are plugged with “$250,000.” Before 2009, the upper open-ended interval was 100,000 U.S. dollars and a plug of “$100,000” was used.
Learn more about how Statista can support your business.
US Census Bureau. (September 16, 2024). Median household income in the United States in 2023, by state (in 2023 U.S. dollars) [Graph]. In Statista. Retrieved May 12, 2025, from https://www.statista.com/statistics/233170/median-household-income-in-the-united-states-by-state/
US Census Bureau. "Median household income in the United States in 2023, by state (in 2023 U.S. dollars)." Chart. September 16, 2024. Statista. Accessed May 12, 2025. https://www.statista.com/statistics/233170/median-household-income-in-the-united-states-by-state/
US Census Bureau. (2024). Median household income in the United States in 2023, by state (in 2023 U.S. dollars). Statista. Statista Inc.. Accessed: May 12, 2025. https://www.statista.com/statistics/233170/median-household-income-in-the-united-states-by-state/
US Census Bureau. "Median Household Income in The United States in 2023, by State (in 2023 U.S. Dollars)." Statista, Statista Inc., 16 Sep 2024, https://www.statista.com/statistics/233170/median-household-income-in-the-united-states-by-state/
US Census Bureau, Median household income in the United States in 2023, by state (in 2023 U.S. dollars) Statista, https://www.statista.com/statistics/233170/median-household-income-in-the-united-states-by-state/ (last visited May 12, 2025)
Median household income in the United States in 2023, by state (in 2023 U.S. dollars) [Graph], US Census Bureau, September 16, 2024. [Online]. Available: https://www.statista.com/statistics/233170/median-household-income-in-the-united-states-by-state/
Profit from additional features with an Employee Account
Please create an employee account to be able to mark statistics as favorites.
Then you can access your favorite statistics via the star in the header.
Profit from the additional features of your individual account
Currently, you are using a shared account. To use individual functions (e.g., mark statistics as favourites, set
statistic alerts) please log in with your personal account.
If you are an admin, please authenticate by logging in again.