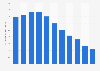
Wine consumption had been increasing in the United States until recently. Consumption reached a high of 3.16 gallons per person in 2021. By 2023, per capita consumption had dropped 15 percent to 2.68 gallons.
Advertisement
Advertisement
Average wine consumption per United States resident from 2005 to 2023 (in gallons)*
Characteristic
Consumption per resident in gallons
2023
2.68
2022
2.96
2021
3.16
2020
3.12
2019
2.94
2018
3
2017
2.97
2016
2.93
2015
2.87
2014
2.82
2013
2.81
2012
2.77
2011
2.7
00.511.522.533.5
Add this content to your personal favorites. These can be accessed from the favorites menu in the main navigation.
You have no right to use this feature.
Make sure to contact us if you are interested in scientific citation.
You can upgrade your account to enable this functionality for all statistics.
This feature is not available with your current account.Request access
* All wine types including sparkling wine, dessert wine, vermouth, other special natural and table wine. Based upon Bureau of the Census estimated resident population. Per capita consumption will be higher if based on legal drinking age population.
Learn more about how Statista can support your business.
Wine Institute. (November 4, 2024). Average wine consumption per United States resident from 2005 to 2023 (in gallons)* [Graph]. In Statista. Retrieved July 12, 2025, from https://www.statista.com/statistics/233734/average-wine-consuimption-of-the-us-per-resident/
Wine Institute. "Average wine consumption per United States resident from 2005 to 2023 (in gallons)*." Chart. November 4, 2024. Statista. Accessed July 12, 2025. https://www.statista.com/statistics/233734/average-wine-consuimption-of-the-us-per-resident/
Wine Institute. (2024). Average wine consumption per United States resident from 2005 to 2023 (in gallons)*. Statista. Statista Inc.. Accessed: July 12, 2025. https://www.statista.com/statistics/233734/average-wine-consuimption-of-the-us-per-resident/
Wine Institute. "Average Wine Consumption per United States Resident from 2005 to 2023 (in Gallons)*." Statista, Statista Inc., 4 Nov 2024, https://www.statista.com/statistics/233734/average-wine-consuimption-of-the-us-per-resident/
Wine Institute, Average wine consumption per United States resident from 2005 to 2023 (in gallons)* Statista, https://www.statista.com/statistics/233734/average-wine-consuimption-of-the-us-per-resident/ (last visited July 12, 2025)
Average wine consumption per United States resident from 2005 to 2023 (in gallons)* [Graph], Wine Institute, November 4, 2024. [Online]. Available: https://www.statista.com/statistics/233734/average-wine-consuimption-of-the-us-per-resident/
Advertisement
Profit from additional features with an Employee Account
Please create an employee account to be able to mark statistics as favorites.
Then you can access your favorite statistics via the star in the header.
Profit from the additional features of your individual account
Currently, you are using a shared account. To use individual functions (e.g., mark statistics as favourites, set
statistic alerts) please log in with your personal account.
If you are an admin, please authenticate by logging in again.