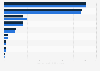
In 2021, Shanghai Electric Group Co., Ltd. generated a revenue of approximately 42 billion yuan in industrial facilities, 59 billion yuan in new energy equipment, and 39 billion yuan in integration services.
Advertisement
Advertisement
Revenue of Shanghai Electric Group Co., Ltd from 2010 to 2021, by sector
(in billion yuan)
Profit from the additional features of your individual account
Currently, you are using a shared account. To use individual functions (e.g., mark statistics as favourites, set
statistic alerts) please log in with your personal account.
If you are an admin, please authenticate by logging in again.
Learn more about how Statista can support your business.
Shanghai Electric. (April 19, 2021). Revenue of Shanghai Electric Group Co., Ltd from 2010 to 2021, by sector (in billion yuan) [Graph]. In Statista. Retrieved June 24, 2025, from https://www.statista.com/statistics/233757/revenue-of-shanghai-electric-by-sector/
Shanghai Electric. "Revenue of Shanghai Electric Group Co., Ltd from 2010 to 2021, by sector (in billion yuan)." Chart. April 19, 2021. Statista. Accessed June 24, 2025. https://www.statista.com/statistics/233757/revenue-of-shanghai-electric-by-sector/
Shanghai Electric. (2021). Revenue of Shanghai Electric Group Co., Ltd from 2010 to 2021, by sector (in billion yuan). Statista. Statista Inc.. Accessed: June 24, 2025. https://www.statista.com/statistics/233757/revenue-of-shanghai-electric-by-sector/
Shanghai Electric. "Revenue of Shanghai Electric Group Co., Ltd from 2010 to 2021, by Sector (in Billion Yuan)." Statista, Statista Inc., 19 Apr 2021, https://www.statista.com/statistics/233757/revenue-of-shanghai-electric-by-sector/
Shanghai Electric, Revenue of Shanghai Electric Group Co., Ltd from 2010 to 2021, by sector (in billion yuan) Statista, https://www.statista.com/statistics/233757/revenue-of-shanghai-electric-by-sector/ (last visited June 24, 2025)
Revenue of Shanghai Electric Group Co., Ltd from 2010 to 2021, by sector (in billion yuan) [Graph], Shanghai Electric, April 19, 2021. [Online]. Available: https://www.statista.com/statistics/233757/revenue-of-shanghai-electric-by-sector/