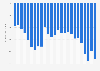
This timeline depicts Texas' imports and exports of goods from January 2017 to January 2025. In January 2025, the value of Texas' imports amounted to about 32.5 billion U.S. dollars; its exports valued around 37.7 billion U.S. dollars that month.
Texas' imports and exports of goods from January 2017 to January 2025
(in million U.S. dollars)
Month and year
Imports
Exports
Jan 25
32,457
37,740
Dec 24
31,756
37,265
Nov 24
32,427
38,783
Oct 24
34,315
37,401
Sep 24
35,002
36,092
Aug 24
34,543
39,202
Jul 24
32,777
38,747
Jun 24
34,342
37,610
May 24
35,731
38,634
Apr 24
33,547
39,333
Mar 24
32,281
38,279
Feb 24
30,014
36,948
Jan 24
30,440
36,737
Dec 23
33,662.7
38,057
Nov 23
31,872.4
35,877.3
Oct 23
32,939.9
35,592.8
Sep 23
32,768.6
36,238.7
Aug 23
31,660
35,572
Jul 23
32,559.5
40,645.2
Jun 23
29,353.2
34,232
May 23
29,828.3
36,628.5
Apr 23
29,766.6
37,533.4
Mar 23
30,791.1
39,117.4
Feb 23
32,380.6
41,819.9
Jan 23
33,313.8
39,973.4
Dec 22
33,961.4
43,253.2
Nov 22
34,272.3
42,739.4
Oct 22
34,283.3
43,563.9
Sep 22
33,313.85
39,973.44
Aug 22
33,961.44
43,253.16
Jul 22
34,272.27
42,739.44
Jun 22
34,283.26
43,563.95
May 22
33,081.14
43,963.53
Apr 22
32,431.41
41,233.37
Mar 22
34,556.51
42,077.71
Feb 22
26,307.84
34,926.07
Jan 22
29,259.78
35,423.2
Dec 21
29,254.5
35,492.48
Nov 21
29,716.6
34,876.97
Oct 21
28,792.83
36,476.04
Sep 21
27,407.04
30,860.29
Aug 21
26,648.07
33,332.8
Jul 21
27,167.25
32,318.86
Jun 21
26,980.43
31,631.13
May 21
24,370.04
30,114.57
Apr 21
25,534.39
29,733.3
Mar 21
25,449.96
28,254.18
Feb 21
19,344.28
24,874.08
Jan 21
22,017.73
27,358.92
Dec 20
22,349.67
26,119.37
Nov 20
22,056.6
23,579.82
Oct 20
22,654.67
25,282.01
Sep 20
21,107.39
22,750.55
Aug 20
21,821.46
22,226.2
Jul 20
21,453.52
22,371.79
Jun 20
18,740.96
19,716.88
May 20
15,834.42
15,802.11
Apr 20
16,407.13
18,964.31
Mar 20
21,302.9
26,945.17
Feb 20
21,417.81
27,397.21
Jan 20
22,807.34
28,138.23
Dec 19
22,464.37
29,241.59
Nov 19
22,243.85
27,668.12
Oct 19
24,597.29
29,274.6
Sep 19
23,369.71
26,829.31
Aug 19
26,112.43
27,381.23
Jul 19
25,197.54
27,785.12
Jun 19
24,389.95
27,097.3
May 19
26,631.3
28,448.13
Apr 19
25,383.07
27,942.35
Mar 19
25,844.27
27,904.49
Feb 19
22,904.95
24,651.8
Jan 19
25,626.7
26,277.46
Dec 18
24,113.11
25,527.4
Nov 18
24,881.53
27,758.46
Oct 18
28,014.33
29,207.35
Sep 18
26,956.72
26,549.8
Aug 18
28,132.61
25,536.75
Jul 18
27,495.6
27,112.66
Jun 18
26,432.48
26,838.6
May 18
25,773.78
27,485.11
Apr 18
24,256.31
26,350.1
Mar 18
24,658.96
26,439.17
Feb 18
20,898.97
22,880.1
Jan 18
23,008.86
23,762.27
Dec 17
22,691.3
24,280.16
Nov 17
23,122.09
23,852.45
Oct 17
23,576.13
24,637.32
Sep 17
21,263.77
20,825.48
Aug 17
21,873.98
20,783.52
Jul 17
21,457.23
21,302.12
Jun 17
22,995.07
22,112.37
May 17
22,808.16
21,762.4
Apr 17
20,852.28
21,000
Mar 17
22,748.96
22,323.44
Feb 17
19,227.91
20,347.48
Jan 17
20,672.06
20,858.87
Zoomable Statistic: Select the range in the chart you want to zoom in on.
By NAICS-based product code groupings.
Not seasonally adjusted.
Imports and exports include manufactured and nonmanufactured commodities. Furthermore, exports include reexports.
Export data is to be found here.
Profit from the additional features of your individual account
Currently, you are using a shared account. To use individual functions (e.g., mark statistics as favourites, set
statistic alerts) please log in with your personal account.
If you are an admin, please authenticate by logging in again.
Learn more about how Statista can support your business.
US Census Bureau. (February 5, 2025). Texas' imports and exports of goods from January 2017 to January 2025 (in million U.S. dollars) [Graph]. In Statista. Retrieved June 04, 2025, from https://www.statista.com/statistics/234859/imports-and-exports-of-goods-of-texas/
US Census Bureau. "Texas' imports and exports of goods from January 2017 to January 2025 (in million U.S. dollars)." Chart. February 5, 2025. Statista. Accessed June 04, 2025. https://www.statista.com/statistics/234859/imports-and-exports-of-goods-of-texas/
US Census Bureau. (2025). Texas' imports and exports of goods from January 2017 to January 2025 (in million U.S. dollars). Statista. Statista Inc.. Accessed: June 04, 2025. https://www.statista.com/statistics/234859/imports-and-exports-of-goods-of-texas/
US Census Bureau. "Texas' Imports and Exports of Goods from January 2017 to January 2025 (in Million U.S. Dollars)." Statista, Statista Inc., 5 Feb 2025, https://www.statista.com/statistics/234859/imports-and-exports-of-goods-of-texas/
US Census Bureau, Texas' imports and exports of goods from January 2017 to January 2025 (in million U.S. dollars) Statista, https://www.statista.com/statistics/234859/imports-and-exports-of-goods-of-texas/ (last visited June 04, 2025)
Texas' imports and exports of goods from January 2017 to January 2025 (in million U.S. dollars) [Graph], US Census Bureau, February 5, 2025. [Online]. Available: https://www.statista.com/statistics/234859/imports-and-exports-of-goods-of-texas/