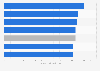
This statistic shows the average percentage of students who had correct scores for all of the interactive computer tasks that were included in the National Assessment of Education Progress (NAEP) for science in 2009 in the United States. Distinctions are shown between results of students by their race or ethnicity and also their grade levels. In 2009, 47 percent of White students in Grade 4 had all correct scores as compared to 32 percent of Black students.
Advertisement
Advertisement
Average percentage of students with correct scores for all interactive computer tasks in the NAEP in science in the United States in 2009, by race and grade level
Profit from the additional features of your individual account
Currently, you are using a shared account. To use individual functions (e.g., mark statistics as favourites, set
statistic alerts) please log in with your personal account.
If you are an admin, please authenticate by logging in again.
Learn more about how Statista can support your business.
NCES. (June 11, 2012). Average percentage of students with correct scores for all interactive computer tasks in the NAEP in science in the United States in 2009, by race and grade level [Graph]. In Statista. Retrieved June 27, 2025, from https://www.statista.com/statistics/235747/naep-science-assessment-results-by-race-and-grade-in-the-us/
NCES. "Average percentage of students with correct scores for all interactive computer tasks in the NAEP in science in the United States in 2009, by race and grade level." Chart. June 11, 2012. Statista. Accessed June 27, 2025. https://www.statista.com/statistics/235747/naep-science-assessment-results-by-race-and-grade-in-the-us/
NCES. (2012). Average percentage of students with correct scores for all interactive computer tasks in the NAEP in science in the United States in 2009, by race and grade level. Statista. Statista Inc.. Accessed: June 27, 2025. https://www.statista.com/statistics/235747/naep-science-assessment-results-by-race-and-grade-in-the-us/
NCES. "Average Percentage of Students with Correct Scores for All Interactive Computer Tasks in The Naep in Science in The United States in 2009, by Race and Grade Level." Statista, Statista Inc., 11 Jun 2012, https://www.statista.com/statistics/235747/naep-science-assessment-results-by-race-and-grade-in-the-us/
NCES, Average percentage of students with correct scores for all interactive computer tasks in the NAEP in science in the United States in 2009, by race and grade level Statista, https://www.statista.com/statistics/235747/naep-science-assessment-results-by-race-and-grade-in-the-us/ (last visited June 27, 2025)
Average percentage of students with correct scores for all interactive computer tasks in the NAEP in science in the United States in 2009, by race and grade level [Graph], NCES, June 11, 2012. [Online]. Available: https://www.statista.com/statistics/235747/naep-science-assessment-results-by-race-and-grade-in-the-us/