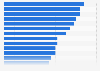
This statistic shows the price increase in food commodities between mid-June and mid-July, 2012. The price of corn increased by 33 percent in this period.
Change in commodity prices of corn, wheat and soy beans between mid-June and mid-July, 2012
Characteristic
Price increase
Soybeans
13%
Wheat
23%
Corn
33%
0%5%10%15%20%25%30%35%40%
Add this content to your personal favorites. These can be accessed from the favorites menu in the main navigation.
You have no right to use this feature.
Make sure to contact us if you are interested in scientific citation.
You can upgrade your account to enable this functionality for all statistics.
This feature is not available with your current account.Request access
Learn more about how Statista can support your business.
Bloomberg. (July 8, 2012). Change in commodity prices of corn, wheat and soy beans between mid-June and mid-July, 2012 [Graph]. In Statista. Retrieved May 12, 2025, from https://www.statista.com/statistics/236976/us-food-commodities-price-change/
Bloomberg. "Change in commodity prices of corn, wheat and soy beans between mid-June and mid-July, 2012." Chart. July 8, 2012. Statista. Accessed May 12, 2025. https://www.statista.com/statistics/236976/us-food-commodities-price-change/
Bloomberg. (2012). Change in commodity prices of corn, wheat and soy beans between mid-June and mid-July, 2012. Statista. Statista Inc.. Accessed: May 12, 2025. https://www.statista.com/statistics/236976/us-food-commodities-price-change/
Bloomberg. "Change in Commodity Prices of Corn, Wheat and Soy Beans between Mid-june and Mid-july, 2012." Statista, Statista Inc., 8 Jul 2012, https://www.statista.com/statistics/236976/us-food-commodities-price-change/
Bloomberg, Change in commodity prices of corn, wheat and soy beans between mid-June and mid-July, 2012 Statista, https://www.statista.com/statistics/236976/us-food-commodities-price-change/ (last visited May 12, 2025)
Change in commodity prices of corn, wheat and soy beans between mid-June and mid-July, 2012 [Graph], Bloomberg, July 8, 2012. [Online]. Available: https://www.statista.com/statistics/236976/us-food-commodities-price-change/
Profit from additional features with an Employee Account
Please create an employee account to be able to mark statistics as favorites.
Then you can access your favorite statistics via the star in the header.
Profit from the additional features of your individual account
Currently, you are using a shared account. To use individual functions (e.g., mark statistics as favourites, set
statistic alerts) please log in with your personal account.
If you are an admin, please authenticate by logging in again.