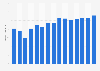
In 2023, ***** billion gallons of bottled water were sold in the United States. Over the last ten years, the country’s bottled water sales volume has increased considerably with each consecutive year.
Consumption in the U.S.
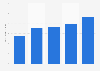
As bottled water volume sales increased in recent years, so did per capita consumption in the United States. Over the last decade, yearly bottled water consumption grew, reaching a total of roughly ** gallons per person in 2023. Bottled water was the ************* consumed beverage among Americans one year earlier, with carbonated soft drinks ranking a ************. Other beverages typically enjoyed included coffee, beer, cider, and milk.
Tap water
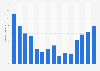
In 2024, ** percent of consumers in the United States strongly agreed that tap water is affordable. By comparison, ***** percent disagreed.
Profit from the additional features of your individual account
Currently, you are using a shared account. To use individual functions (e.g., mark statistics as favourites, set
statistic alerts) please log in with your personal account.
If you are an admin, please authenticate by logging in again.
Learn more about how Statista can support your business.
International Bottled Water Association. (May 21, 2024). Sales volume of bottled water in the United States from 2010 to 2023 (in billion gallons) [Graph]. In Statista. Retrieved July 22, 2025, from https://www.statista.com/statistics/237832/volume-of-bottled-water-in-the-us/
International Bottled Water Association. "Sales volume of bottled water in the United States from 2010 to 2023 (in billion gallons)." Chart. May 21, 2024. Statista. Accessed July 22, 2025. https://www.statista.com/statistics/237832/volume-of-bottled-water-in-the-us/
International Bottled Water Association. (2024). Sales volume of bottled water in the United States from 2010 to 2023 (in billion gallons). Statista. Statista Inc.. Accessed: July 22, 2025. https://www.statista.com/statistics/237832/volume-of-bottled-water-in-the-us/
International Bottled Water Association. "Sales Volume of Bottled Water in The United States from 2010 to 2023 (in Billion Gallons)." Statista, Statista Inc., 21 May 2024, https://www.statista.com/statistics/237832/volume-of-bottled-water-in-the-us/
International Bottled Water Association, Sales volume of bottled water in the United States from 2010 to 2023 (in billion gallons) Statista, https://www.statista.com/statistics/237832/volume-of-bottled-water-in-the-us/ (last visited July 22, 2025)
Sales volume of bottled water in the United States from 2010 to 2023 (in billion gallons) [Graph], International Bottled Water Association, May 21, 2024. [Online]. Available: https://www.statista.com/statistics/237832/volume-of-bottled-water-in-the-us/