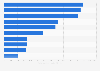
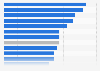
In the first quarter of 2025, online shoppers spent an average of about **** U.S. dollars per visit across all verticals. Electronics is the category in which consumers spent the most money per visit on average, at **** U.S. dollars, followed by apparel at **** dollars.
Nickels and dimes
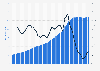
Over the past few years, the average order value for e-commerce purchases has increased globally, from around *** U.S. dollars in September 2022 to around *** U.S. dollars in the same month of 2024. The average order value also depends heavily on the online traffic source consumers use. In 2024, the value per order value was the highest when navigating directly, averaging around *** U.S. dollars. Direct navigation means searching for a website directly in the browser's address bar, bypassing the use of search engines. Orders placed from social media stores were the lowest in value, with an average of less than ** dollars.
Mobile shopping on the rise
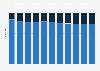
Online shoppers have clear preferences when it comes to device type. When comparing gadgets, the average purchase amount has always been the highest for desktops, with an order value of over *** U.S. dollars. This indicates that bigger purchases are made via desktop computers. However, consumers are more likely to complete orders when shopping on mobile devices. Mobile devices were also clearly preferred when browsing retail websites, with around three-fourths of consumers using smartphones instead of desktops or tablets.
Profit from the additional features of your individual account
Currently, you are using a shared account. To use individual functions (e.g., mark statistics as favourites, set
statistic alerts) please log in with your personal account.
If you are an admin, please authenticate by logging in again.
Learn more about how Statista can support your business.
Salesforce Research. (June 2, 2025). Average e-commerce spending per online shopper worldwide per visit in the 1st quarter of 2025, by category (in U.S. dollars) [Graph]. In Statista. Retrieved June 22, 2025, from https://www.statista.com/statistics/239288/countries-ranked-by-average-b2c-e-commerce-spending-per-online-buyer/
Salesforce Research. "Average e-commerce spending per online shopper worldwide per visit in the 1st quarter of 2025, by category (in U.S. dollars)." Chart. June 2, 2025. Statista. Accessed June 22, 2025. https://www.statista.com/statistics/239288/countries-ranked-by-average-b2c-e-commerce-spending-per-online-buyer/
Salesforce Research. (2025). Average e-commerce spending per online shopper worldwide per visit in the 1st quarter of 2025, by category (in U.S. dollars). Statista. Statista Inc.. Accessed: June 22, 2025. https://www.statista.com/statistics/239288/countries-ranked-by-average-b2c-e-commerce-spending-per-online-buyer/
Salesforce Research. "Average E-commerce Spending per Online Shopper Worldwide per Visit in The 1st Quarter of 2025, by Category (in U.S. Dollars)." Statista, Statista Inc., 2 Jun 2025, https://www.statista.com/statistics/239288/countries-ranked-by-average-b2c-e-commerce-spending-per-online-buyer/
Salesforce Research, Average e-commerce spending per online shopper worldwide per visit in the 1st quarter of 2025, by category (in U.S. dollars) Statista, https://www.statista.com/statistics/239288/countries-ranked-by-average-b2c-e-commerce-spending-per-online-buyer/ (last visited June 22, 2025)
Average e-commerce spending per online shopper worldwide per visit in the 1st quarter of 2025, by category (in U.S. dollars) [Graph], Salesforce Research, June 2, 2025. [Online]. Available: https://www.statista.com/statistics/239288/countries-ranked-by-average-b2c-e-commerce-spending-per-online-buyer/