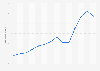
In 2024, home improvement sales in the United States amounted to around ***** billion U.S. dollars. By 2028, this amount is expected to reach almost *** billion U.S. dollars.
Home improvement chains
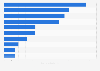
With sales close the *** billion U.S. dollar mark, The Home Depot was the leading home improvement chain in the United States in 2023. Other large chains in the industry included Lowe’s (Home Depot’s main competitor), Sherwin-Williams, Tractor Supply, and Menards that year. In terms of customer satisfaction however, The Home Depot ranked fourth in 2024, while Menards received the highest ratings.
The Home Depot
Home Depot is the largest home improvement retail store in the United States. The company was founded in Atlanta, Georgia in 1978. When visiting one of their stores, consumers would typically spend an average of ***** U.S. dollars in 2024. Lowe’s customers, on the other hand, spent about ****** U.S. dollars per visit.
*Estimate. Revised. Figures prior to 2023 were taken from previous editions of the publication. Total sales figures are derived from a formula that incorporates information from NRHA's Annual Cost of Doing Business Study, direct retailer research, the U.S. Department of Commerce NAICS 444 sales reports and information from other research outlets. Industry estimates consider sales from all retailers whose primary business is selling home improvement products. Estimates include sales through the industry's hardware stores, home centers, big-box outlets, and retail lumberyards.
Profit from the additional features of your individual account
Currently, you are using a shared account. To use individual functions (e.g., mark statistics as favourites, set
statistic alerts) please log in with your personal account.
If you are an admin, please authenticate by logging in again.
Learn more about how Statista can support your business.
NHPA. (December 31, 2024). Home improvement market size in the United States from 2008 to 2028 (in billion U.S. dollars) [Graph]. In Statista. Retrieved July 01, 2025, from https://www.statista.com/statistics/239753/total-sales-of-home-improvement-retailers-in-the-us/
NHPA. "Home improvement market size in the United States from 2008 to 2028 (in billion U.S. dollars)." Chart. December 31, 2024. Statista. Accessed July 01, 2025. https://www.statista.com/statistics/239753/total-sales-of-home-improvement-retailers-in-the-us/
NHPA. (2024). Home improvement market size in the United States from 2008 to 2028 (in billion U.S. dollars). Statista. Statista Inc.. Accessed: July 01, 2025. https://www.statista.com/statistics/239753/total-sales-of-home-improvement-retailers-in-the-us/
NHPA. "Home Improvement Market Size in The United States from 2008 to 2028 (in Billion U.S. Dollars)." Statista, Statista Inc., 31 Dec 2024, https://www.statista.com/statistics/239753/total-sales-of-home-improvement-retailers-in-the-us/
NHPA, Home improvement market size in the United States from 2008 to 2028 (in billion U.S. dollars) Statista, https://www.statista.com/statistics/239753/total-sales-of-home-improvement-retailers-in-the-us/ (last visited July 01, 2025)
Home improvement market size in the United States from 2008 to 2028 (in billion U.S. dollars) [Graph], NHPA, December 31, 2024. [Online]. Available: https://www.statista.com/statistics/239753/total-sales-of-home-improvement-retailers-in-the-us/