Industrial activities are the greatest energy end-user sector in the United States, reaching a consumption of some 31 quadrillion British thermal units in 2023, followed by the transportation sector. The U.S. is the second-largest energy consumer in the world, after China.
Although around 60 percent of the electricity generated in the U.S. is derived from natural gas and coal, the use of renewable sources is becoming more common in electricity production, wind the largest increase in wind and solar power. These two clean energy resources are projected to generate as much power as natural gas by 2030.
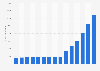
Total energy consumption in the United States from 1975 to 2023, by sector
(in quadrillion British thermal units)
Total energy consumption in the end-use sectors consists of primary energy
consumption, electricity retail sales, and electrical system energy losses.
According to the source, figures for the commercial sector include data for commercial combined-heat-and-power (CHP) and commercial electricity-only plants; the industrial sector includes industrial combined-heat-and-power (CHP) and industrial electricity-only plants.
Profit from the additional features of your individual account
Currently, you are using a shared account. To use individual functions (e.g., mark statistics as favourites, set
statistic alerts) please log in with your personal account.
If you are an admin, please authenticate by logging in again.
Learn more about how Statista can support your business.
EIA (U.S. Energy Information Administration). (January 28, 2025). Total energy consumption in the United States from 1975 to 2023, by sector (in quadrillion British thermal units) [Graph]. In Statista. Retrieved May 12, 2025, from https://www.statista.com/statistics/239790/total-energy-consumption-in-the-united-states-by-sector/
EIA (U.S. Energy Information Administration). "Total energy consumption in the United States from 1975 to 2023, by sector (in quadrillion British thermal units)." Chart. January 28, 2025. Statista. Accessed May 12, 2025. https://www.statista.com/statistics/239790/total-energy-consumption-in-the-united-states-by-sector/
EIA (U.S. Energy Information Administration). (2025). Total energy consumption in the United States from 1975 to 2023, by sector (in quadrillion British thermal units). Statista. Statista Inc.. Accessed: May 12, 2025. https://www.statista.com/statistics/239790/total-energy-consumption-in-the-united-states-by-sector/
EIA (U.S. Energy Information Administration). "Total Energy Consumption in The United States from 1975 to 2023, by Sector (in Quadrillion British Thermal Units)." Statista, Statista Inc., 28 Jan 2025, https://www.statista.com/statistics/239790/total-energy-consumption-in-the-united-states-by-sector/
EIA (U.S. Energy Information Administration), Total energy consumption in the United States from 1975 to 2023, by sector (in quadrillion British thermal units) Statista, https://www.statista.com/statistics/239790/total-energy-consumption-in-the-united-states-by-sector/ (last visited May 12, 2025)
Total energy consumption in the United States from 1975 to 2023, by sector (in quadrillion British thermal units) [Graph], EIA (U.S. Energy Information Administration), January 28, 2025. [Online]. Available: https://www.statista.com/statistics/239790/total-energy-consumption-in-the-united-states-by-sector/