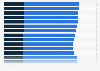
In 2021 in the United States, **** percent of doctorate recipients fell within the age bracket of 26 to 30 years old. A further **** percent of doctorate recipients were between the ages of 31 and 35 years old.
Profit from the additional features of your individual account
Currently, you are using a shared account. To use individual functions (e.g., mark statistics as favourites, set
statistic alerts) please log in with your personal account.
If you are an admin, please authenticate by logging in again.
Learn more about how Statista can support your business.
NCSES. (October 18, 2022). Distribution of doctorate recipients in the United States in 2021, by age group [Graph]. In Statista. Retrieved June 26, 2025, from https://www.statista.com/statistics/240152/age-distribution-of-us-doctorate-recipients/
NCSES. "Distribution of doctorate recipients in the United States in 2021, by age group." Chart. October 18, 2022. Statista. Accessed June 26, 2025. https://www.statista.com/statistics/240152/age-distribution-of-us-doctorate-recipients/
NCSES. (2022). Distribution of doctorate recipients in the United States in 2021, by age group. Statista. Statista Inc.. Accessed: June 26, 2025. https://www.statista.com/statistics/240152/age-distribution-of-us-doctorate-recipients/
NCSES. "Distribution of Doctorate Recipients in The United States in 2021, by Age Group." Statista, Statista Inc., 18 Oct 2022, https://www.statista.com/statistics/240152/age-distribution-of-us-doctorate-recipients/
NCSES, Distribution of doctorate recipients in the United States in 2021, by age group Statista, https://www.statista.com/statistics/240152/age-distribution-of-us-doctorate-recipients/ (last visited June 26, 2025)
Distribution of doctorate recipients in the United States in 2021, by age group [Graph], NCSES, October 18, 2022. [Online]. Available: https://www.statista.com/statistics/240152/age-distribution-of-us-doctorate-recipients/