This statistic shows the share of federal budget outlays that were spent on children as compared to other items in the United States from 1960 to 2011. A projection is also shown for 2022. In 2011, 10 percent of the federal budget was spent on services directed towards children. By 2022 it is expected the share will have decreased to 8 percent.
Advertisement
Advertisement
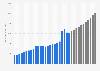
Share of U.S. federal budget outlays spent on children vs other items from 1960 to 2022
Characteristic
Children
Social security, medicare, and medicaid
Defense
Interest on the debt
All other outlays
2022*
8%
51%
13%
11%
16%
2011
10%
41%
20%
6%
23%
2010
11%
38%
20%
6%
25%
2000
9%
38%
16%
9%
28%
1990
5%
30%
24%
15%
26%
1980
7%
26%
23%
9%
36%
1970
5%
18%
42%
7%
27%
1960
3%
11%
52%
8%
26%
0%25%50%75%100%125%
Add this content to your personal favorites. These can be accessed from the favorites menu in the main navigation.
You have no right to use this feature.
Make sure to contact us if you are interested in scientific citation.
You can upgrade your account to enable this functionality for all statistics.
This feature is not available with your current account.Request access
Learn more about how Statista can support your business.
Urban Institute. (July 19, 2012). Share of U.S. federal budget outlays spent on children vs other items from 1960 to 2022 [Graph]. In Statista. Retrieved July 18, 2025, from https://www.statista.com/statistics/240428/us-federal-outlays-spent-on-children-vs-other-items/
Urban Institute. "Share of U.S. federal budget outlays spent on children vs other items from 1960 to 2022." Chart. July 19, 2012. Statista. Accessed July 18, 2025. https://www.statista.com/statistics/240428/us-federal-outlays-spent-on-children-vs-other-items/
Urban Institute. (2012). Share of U.S. federal budget outlays spent on children vs other items from 1960 to 2022. Statista. Statista Inc.. Accessed: July 18, 2025. https://www.statista.com/statistics/240428/us-federal-outlays-spent-on-children-vs-other-items/
Urban Institute. "Share of U.S. Federal Budget Outlays Spent on Children Vs Other Items from 1960 to 2022." Statista, Statista Inc., 19 Jul 2012, https://www.statista.com/statistics/240428/us-federal-outlays-spent-on-children-vs-other-items/
Urban Institute, Share of U.S. federal budget outlays spent on children vs other items from 1960 to 2022 Statista, https://www.statista.com/statistics/240428/us-federal-outlays-spent-on-children-vs-other-items/ (last visited July 18, 2025)
Share of U.S. federal budget outlays spent on children vs other items from 1960 to 2022 [Graph], Urban Institute, July 19, 2012. [Online]. Available: https://www.statista.com/statistics/240428/us-federal-outlays-spent-on-children-vs-other-items/
Advertisement
Profit from additional features with an Employee Account
Please create an employee account to be able to mark statistics as favorites.
Then you can access your favorite statistics via the star in the header.
Profit from the additional features of your individual account
Currently, you are using a shared account. To use individual functions (e.g., mark statistics as favourites, set
statistic alerts) please log in with your personal account.
If you are an admin, please authenticate by logging in again.