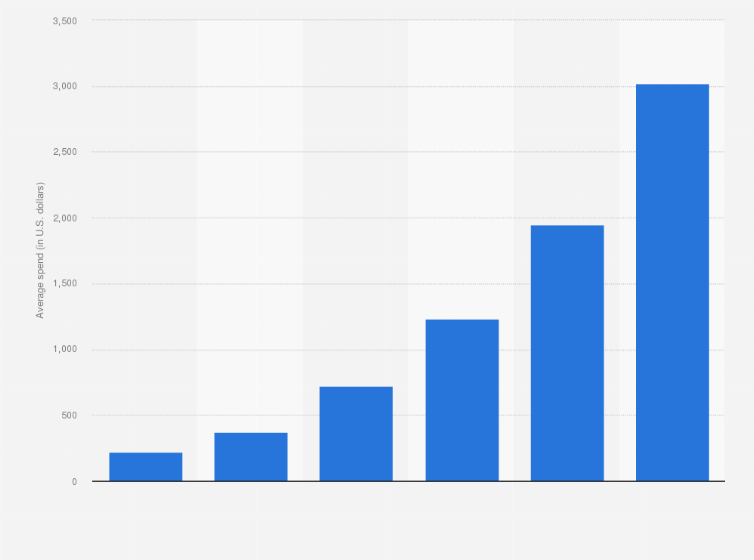
This statistic gives information on the average annual spending per proximity mobile payment transaction user in the United States from 2014 to 2019, in U.S. dollars. In 2018, U.S. users are projected to spend more than 1,949 U.S. dollars per year through near-field-communications or other contactless technology.
Average annual spending per proximity mobile payment transaction user in the United States in 2014 with forecasts from 2016 to 2019
(in U.S. dollars)
Adjust the presentation of the statistic and data points.
Share the statistic on social media channels or embed the statistic in your
website using "Embed Code", where available.
Cite this statistic and select one of the following formats: APA, Chicago, Harvard, MLA & Bluebook.
Print the statistic including description and metadata.
Chart type
Average annual spending per proximity mobile payment transaction user in the United States in 2014 with forecasts from 2016 to 2019
Share this statistic
You have no right to use this feature.
Make sure to contact us if you are interested in scientific citation.
You can upgrade your account to enable this functionality for all statistics.
This feature is not available with your current account.Request access
Includes point of sale transactions made by using a mobile device as a payment method, including scanning, tapping, swiping or checking in with a mobile device at the point of sale; excludes purchases of digital goods on mobile devices, purchases made remotely on mobile devices that are delivered later on, and transactions made via tablets.
Learn more about how Statista can support your business.
eMarketer. (February 8, 2016). Average annual spending per proximity mobile payment transaction user in the United States in 2014 with forecasts from 2016 to 2019 (in U.S. dollars) [Graph]. In Statista. Retrieved June 03, 2025, from https://www.statista.com/statistics/244496/average-spending-per-us-proximity-mobile-payment-transaction-user/
eMarketer. "Average annual spending per proximity mobile payment transaction user in the United States in 2014 with forecasts from 2016 to 2019 (in U.S. dollars)." Chart. February 8, 2016. Statista. Accessed June 03, 2025. https://www.statista.com/statistics/244496/average-spending-per-us-proximity-mobile-payment-transaction-user/
eMarketer. (2016). Average annual spending per proximity mobile payment transaction user in the United States in 2014 with forecasts from 2016 to 2019 (in U.S. dollars). Statista. Statista Inc.. Accessed: June 03, 2025. https://www.statista.com/statistics/244496/average-spending-per-us-proximity-mobile-payment-transaction-user/
eMarketer. "Average Annual Spending per Proximity Mobile Payment Transaction User in The United States in 2014 with Forecasts from 2016 to 2019 (in U.S. Dollars)." Statista, Statista Inc., 8 Feb 2016, https://www.statista.com/statistics/244496/average-spending-per-us-proximity-mobile-payment-transaction-user/
eMarketer, Average annual spending per proximity mobile payment transaction user in the United States in 2014 with forecasts from 2016 to 2019 (in U.S. dollars) Statista, https://www.statista.com/statistics/244496/average-spending-per-us-proximity-mobile-payment-transaction-user/ (last visited June 03, 2025)
Average annual spending per proximity mobile payment transaction user in the United States in 2014 with forecasts from 2016 to 2019 (in U.S. dollars) [Graph], eMarketer, February 8, 2016. [Online]. Available: https://www.statista.com/statistics/244496/average-spending-per-us-proximity-mobile-payment-transaction-user/
Profit from additional features with an Employee Account
Please create an employee account to be able to mark statistics as favorites.
Then you can access your favorite statistics via the star in the header.
Profit from the additional features of your individual account
Currently, you are using a shared account. To use individual functions (e.g., mark statistics as favourites, set
statistic alerts) please log in with your personal account.
If you are an admin, please authenticate by logging in again.