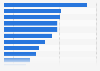
The operating expenses of shareholder-owned electric utilities in the United States amounted to approximately 327.81 billion U.S. dollars in 2023, down by nearly five percent compared to a year earlier. Electrical generation costs accounted for the largest share of operating expenses.
Operating expenses of shareholder-owned electric utilities in the United States from 2010 to 2023
(in billion U.S. dollars)
Characteristic
Expenses in billion U.S. dollars
2023
327.81
2022
344.76
2021
297.57
2020
276.9
2019
286.64
2018
297.3
2017
283.01
2016
277.39
2015
281.17
2014
303.34
2013
285.6
2012
278.11
2011
306.04
050100150200250300350400
Add this content to your personal favorites. These can be accessed from the favorites menu in the main navigation.
You have no right to use this feature.
Make sure to contact us if you are interested in scientific citation.
You can upgrade your account to enable this functionality for all statistics.
This feature is not available with your current account.Request access
Learn more about how Statista can support your business.
Edison Electric Institute. (June 26, 2024). Operating expenses of shareholder-owned electric utilities in the United States from 2010 to 2023 (in billion U.S. dollars) [Graph]. In Statista. Retrieved May 02, 2025, from https://www.statista.com/statistics/245837/operating-expenses-of-us-shareholder-owned-utilities/
Edison Electric Institute. "Operating expenses of shareholder-owned electric utilities in the United States from 2010 to 2023 (in billion U.S. dollars)." Chart. June 26, 2024. Statista. Accessed May 02, 2025. https://www.statista.com/statistics/245837/operating-expenses-of-us-shareholder-owned-utilities/
Edison Electric Institute. (2024). Operating expenses of shareholder-owned electric utilities in the United States from 2010 to 2023 (in billion U.S. dollars). Statista. Statista Inc.. Accessed: May 02, 2025. https://www.statista.com/statistics/245837/operating-expenses-of-us-shareholder-owned-utilities/
Edison Electric Institute. "Operating Expenses of Shareholder-owned Electric Utilities in The United States from 2010 to 2023 (in Billion U.S. Dollars)." Statista, Statista Inc., 26 Jun 2024, https://www.statista.com/statistics/245837/operating-expenses-of-us-shareholder-owned-utilities/
Edison Electric Institute, Operating expenses of shareholder-owned electric utilities in the United States from 2010 to 2023 (in billion U.S. dollars) Statista, https://www.statista.com/statistics/245837/operating-expenses-of-us-shareholder-owned-utilities/ (last visited May 02, 2025)
Operating expenses of shareholder-owned electric utilities in the United States from 2010 to 2023 (in billion U.S. dollars) [Graph], Edison Electric Institute, June 26, 2024. [Online]. Available: https://www.statista.com/statistics/245837/operating-expenses-of-us-shareholder-owned-utilities/
Profit from additional features with an Employee Account
Please create an employee account to be able to mark statistics as favorites.
Then you can access your favorite statistics via the star in the header.
Profit from the additional features of your individual account
Currently, you are using a shared account. To use individual functions (e.g., mark statistics as favourites, set
statistic alerts) please log in with your personal account.
If you are an admin, please authenticate by logging in again.