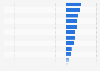
This statistic describes the average change in health spending levels in the United States in the past 20 years from 2013 to 2023, sorted by category. The net costs for health insurance saw an average increase of six percent between 2013 and 2023.
Advertisement
Advertisement
Average change in health spending levels in the United States from 2013 to 2023, by category
Spending refers to National Health Expenditures.
* Government administration includes the administrative costs of government health care programs such as Medicare and Medicaid.
Investment includes noncommercial research, structures, and equipment.
Net cost of health insurance reflects the difference between benefits and premiums for private insurance and includes administrative expenses, premium taxes, and profits.
Other health care refers to other health, residential, and personal care.
Other medical products is durable medical equipment and nondurable medical products.
Profit from the additional features of your individual account
Currently, you are using a shared account. To use individual functions (e.g., mark statistics as favourites, set
statistic alerts) please log in with your personal account.
If you are an admin, please authenticate by logging in again.
Learn more about how Statista can support your business.
CHCF. (December 26, 2024). Average change in health spending levels in the United States from 2013 to 2023, by category [Graph]. In Statista. Retrieved July 03, 2025, from https://www.statista.com/statistics/247729/change-in-health-spending-levels-in-the-us-by-category/
CHCF. "Average change in health spending levels in the United States from 2013 to 2023, by category." Chart. December 26, 2024. Statista. Accessed July 03, 2025. https://www.statista.com/statistics/247729/change-in-health-spending-levels-in-the-us-by-category/
CHCF. (2024). Average change in health spending levels in the United States from 2013 to 2023, by category. Statista. Statista Inc.. Accessed: July 03, 2025. https://www.statista.com/statistics/247729/change-in-health-spending-levels-in-the-us-by-category/
CHCF. "Average Change in Health Spending Levels in The United States from 2013 to 2023, by Category." Statista, Statista Inc., 26 Dec 2024, https://www.statista.com/statistics/247729/change-in-health-spending-levels-in-the-us-by-category/
CHCF, Average change in health spending levels in the United States from 2013 to 2023, by category Statista, https://www.statista.com/statistics/247729/change-in-health-spending-levels-in-the-us-by-category/ (last visited July 03, 2025)
Average change in health spending levels in the United States from 2013 to 2023, by category [Graph], CHCF, December 26, 2024. [Online]. Available: https://www.statista.com/statistics/247729/change-in-health-spending-levels-in-the-us-by-category/