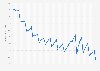
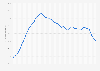
In 2023, the debt services payments to disposable income ratio in the United States has remained relatively stable. That came after a sharp drop of the ratio in 2021 and 2022, which was followed by a rapid increase of the debt service payments, as they represented over 9.8 percent of their personal disposable income in the last quarter of 2023. In this context, debt service refers to the amount of money that households need to pay up their debts, including the interest rates of their loans and lending.
Advertisement
Advertisement
Household debt service payments as a share of disposable personal income in the United States from 1st quarter 2011 to 4th quarter 2023
Profit from the additional features of your individual account
Currently, you are using a shared account. To use individual functions (e.g., mark statistics as favourites, set
statistic alerts) please log in with your personal account.
If you are an admin, please authenticate by logging in again.
Learn more about how Statista can support your business.
St. Louis Fed. (April 2, 2024). Household debt service payments as a share of disposable personal income in the United States from 1st quarter 2011 to 4th quarter 2023 [Graph]. In Statista. Retrieved July 15, 2025, from https://www.statista.com/statistics/248268/debt-service-payments-as-a-percentage-of-disposable-personal-income-in-the-us/
St. Louis Fed. "Household debt service payments as a share of disposable personal income in the United States from 1st quarter 2011 to 4th quarter 2023." Chart. April 2, 2024. Statista. Accessed July 15, 2025. https://www.statista.com/statistics/248268/debt-service-payments-as-a-percentage-of-disposable-personal-income-in-the-us/
St. Louis Fed. (2024). Household debt service payments as a share of disposable personal income in the United States from 1st quarter 2011 to 4th quarter 2023. Statista. Statista Inc.. Accessed: July 15, 2025. https://www.statista.com/statistics/248268/debt-service-payments-as-a-percentage-of-disposable-personal-income-in-the-us/
St. Louis Fed. "Household Debt Service Payments as a Share of Disposable Personal Income in The United States from 1st Quarter 2011 to 4th Quarter 2023." Statista, Statista Inc., 2 Apr 2024, https://www.statista.com/statistics/248268/debt-service-payments-as-a-percentage-of-disposable-personal-income-in-the-us/
St. Louis Fed, Household debt service payments as a share of disposable personal income in the United States from 1st quarter 2011 to 4th quarter 2023 Statista, https://www.statista.com/statistics/248268/debt-service-payments-as-a-percentage-of-disposable-personal-income-in-the-us/ (last visited July 15, 2025)
Household debt service payments as a share of disposable personal income in the United States from 1st quarter 2011 to 4th quarter 2023 [Graph], St. Louis Fed, April 2, 2024. [Online]. Available: https://www.statista.com/statistics/248268/debt-service-payments-as-a-percentage-of-disposable-personal-income-in-the-us/