The statistic depicts the sales of Nestlé Nutrition worldwide by region from 2010 to 2014 in million CHF. In 2013, the Nestlé Nutrition division generated sales of 1.74 billion CHF in Europe. Nestlé Nutrition's total sales amounted to 9.83 billion CHF in that year.
In 2015, Nestlé renamed its reporting regions. The current results may be found here.
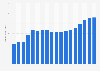
Sales of Nestlé Nutrition worldwide from 2010 to 2014, by region
(in million CHF)
Characteristic
Europe
Americas
Asia, Oceania, and Africa
2010*
1,657
4,010
2,033
2011
1,525
3,577
2,131
2012
1,537
3,805
2,516
2013
1,742
3,724
4,360
2014
1,655
3,323
4,636
02,5005,0007,50010,00012,500
Add this content to your personal favorites. These can be accessed from the favorites menu in the main navigation.
You have no right to use this feature.
Make sure to contact us if you are interested in scientific citation.
You can upgrade your account to enable this functionality for all statistics.
This feature is not available with your current account.Request access
* In 2010 Nestlé restated its accounting policies. Further details can be found under "Note 1" in the Consolidated Financial Statements 2010. CHF is the acronym of Swiss Francs; currency of Switzerland. Data prior to 2013 were taken from previous editions of the publication.
Learn more about how Statista can support your business.
Nestlé. (March 17, 2015). Sales of Nestlé Nutrition worldwide from 2010 to 2014, by region (in million CHF) [Graph]. In Statista. Retrieved May 12, 2025, from https://www.statista.com/statistics/255228/sales-of-nestle-nutrition-worldwide-by-region/
Nestlé. "Sales of Nestlé Nutrition worldwide from 2010 to 2014, by region (in million CHF)." Chart. March 17, 2015. Statista. Accessed May 12, 2025. https://www.statista.com/statistics/255228/sales-of-nestle-nutrition-worldwide-by-region/
Nestlé. (2015). Sales of Nestlé Nutrition worldwide from 2010 to 2014, by region (in million CHF). Statista. Statista Inc.. Accessed: May 12, 2025. https://www.statista.com/statistics/255228/sales-of-nestle-nutrition-worldwide-by-region/
Nestlé. "Sales of Nestlé Nutrition Worldwide from 2010 to 2014, by Region (in Million Chf)." Statista, Statista Inc., 17 Mar 2015, https://www.statista.com/statistics/255228/sales-of-nestle-nutrition-worldwide-by-region/
Nestlé, Sales of Nestlé Nutrition worldwide from 2010 to 2014, by region (in million CHF) Statista, https://www.statista.com/statistics/255228/sales-of-nestle-nutrition-worldwide-by-region/ (last visited May 12, 2025)
Sales of Nestlé Nutrition worldwide from 2010 to 2014, by region (in million CHF) [Graph], Nestlé, March 17, 2015. [Online]. Available: https://www.statista.com/statistics/255228/sales-of-nestle-nutrition-worldwide-by-region/
Profit from additional features with an Employee Account
Please create an employee account to be able to mark statistics as favorites.
Then you can access your favorite statistics via the star in the header.
Profit from the additional features of your individual account
Currently, you are using a shared account. To use individual functions (e.g., mark statistics as favourites, set
statistic alerts) please log in with your personal account.
If you are an admin, please authenticate by logging in again.