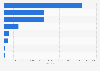
In the fiscal year of 2021, about 156 children from other countries were adopted by American families living in California, the highest of any U.S. state. Texas, Illinois, Virginia, and Florida rounded out the top five states for intercountry adoptions in that year.
Number of incoming intercountry adoptions to the U.S. in FY 2021, by state
Characteristic
Number of adoptions
California
156
Texas
146
Illinois
83
Virginia
82
Florida
79
New York
79
Georgia
70
Maryland
70
North Carolina
68
Pennsylvania
67
Washington
65
Alabama
57
Ohio
54
0102030405060708090100110120130140150160170180
Add this content to your personal favorites. These can be accessed from the favorites menu in the main navigation.
You have no right to use this feature.
Make sure to contact us if you are interested in scientific citation.
You can upgrade your account to enable this functionality for all statistics.
This feature is not available with your current account.Request access
Learn more about how Statista can support your business.
US Department of State, & Bureau of Consular Affairs. (July 14, 2022). Number of incoming intercountry adoptions to the U.S. in FY 2021, by state [Graph]. In Statista. Retrieved June 08, 2025, from https://www.statista.com/statistics/255484/number-of-incoming-intercountry-adoptions-into-the-us-by-state/
US Department of State, und Bureau of Consular Affairs. "Number of incoming intercountry adoptions to the U.S. in FY 2021, by state." Chart. July 14, 2022. Statista. Accessed June 08, 2025. https://www.statista.com/statistics/255484/number-of-incoming-intercountry-adoptions-into-the-us-by-state/
US Department of State, Bureau of Consular Affairs. (2022). Number of incoming intercountry adoptions to the U.S. in FY 2021, by state. Statista. Statista Inc.. Accessed: June 08, 2025. https://www.statista.com/statistics/255484/number-of-incoming-intercountry-adoptions-into-the-us-by-state/
US Department of State, and Bureau of Consular Affairs. "Number of Incoming Intercountry Adoptions to The U.S. in Fy 2021, by State." Statista, Statista Inc., 14 Jul 2022, https://www.statista.com/statistics/255484/number-of-incoming-intercountry-adoptions-into-the-us-by-state/
US Department of State & Bureau of Consular Affairs, Number of incoming intercountry adoptions to the U.S. in FY 2021, by state Statista, https://www.statista.com/statistics/255484/number-of-incoming-intercountry-adoptions-into-the-us-by-state/ (last visited June 08, 2025)
Number of incoming intercountry adoptions to the U.S. in FY 2021, by state [Graph], US Department of State, & Bureau of Consular Affairs, July 14, 2022. [Online]. Available: https://www.statista.com/statistics/255484/number-of-incoming-intercountry-adoptions-into-the-us-by-state/
Profit from additional features with an Employee Account
Please create an employee account to be able to mark statistics as favorites.
Then you can access your favorite statistics via the star in the header.
Profit from the additional features of your individual account
Currently, you are using a shared account. To use individual functions (e.g., mark statistics as favourites, set
statistic alerts) please log in with your personal account.
If you are an admin, please authenticate by logging in again.