This statistic shows the sales of the convenience store industry in the United States in 2011, by category. In that year, convenience stores in the United States generated about 427,097 U.S. dollars worth of fule sales per store per month.
Advertisement
Advertisement
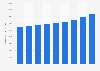
Average sales of U.S. convenience stores per store per month in 2011, by category
(in U.S. dollars)
Category
Average sales in U.S. dollars
Fuel
427,097
Merchandise (less cigarettes)
63,804
Cigarettes
52,045
Food service
23,431
0100,000200,000300,000400,000500,000
Add this content to your personal favorites. These can be accessed from the favorites menu in the main navigation.
You have no right to use this feature.
Make sure to contact us if you are interested in scientific citation.
You can upgrade your account to enable this functionality for all statistics.
This feature is not available with your current account.Request access
Learn more about how Statista can support your business.
CSP. (June 30, 2012). Average sales of U.S. convenience stores per store per month in 2011, by category (in U.S. dollars) [Graph]. In Statista. Retrieved July 04, 2025, from https://www.statista.com/statistics/258044/sales-of-the-us-convenience-store-industry-per-store-per-month/
CSP. "Average sales of U.S. convenience stores per store per month in 2011, by category (in U.S. dollars)." Chart. June 30, 2012. Statista. Accessed July 04, 2025. https://www.statista.com/statistics/258044/sales-of-the-us-convenience-store-industry-per-store-per-month/
CSP. (2012). Average sales of U.S. convenience stores per store per month in 2011, by category (in U.S. dollars). Statista. Statista Inc.. Accessed: July 04, 2025. https://www.statista.com/statistics/258044/sales-of-the-us-convenience-store-industry-per-store-per-month/
CSP. "Average Sales of U.S. Convenience Stores per Store per Month in 2011, by Category (in U.S. Dollars)." Statista, Statista Inc., 30 Jun 2012, https://www.statista.com/statistics/258044/sales-of-the-us-convenience-store-industry-per-store-per-month/
CSP, Average sales of U.S. convenience stores per store per month in 2011, by category (in U.S. dollars) Statista, https://www.statista.com/statistics/258044/sales-of-the-us-convenience-store-industry-per-store-per-month/ (last visited July 04, 2025)
Average sales of U.S. convenience stores per store per month in 2011, by category (in U.S. dollars) [Graph], CSP, June 30, 2012. [Online]. Available: https://www.statista.com/statistics/258044/sales-of-the-us-convenience-store-industry-per-store-per-month/
Advertisement
Profit from additional features with an Employee Account
Please create an employee account to be able to mark statistics as favorites.
Then you can access your favorite statistics via the star in the header.
Profit from the additional features of your individual account
Currently, you are using a shared account. To use individual functions (e.g., mark statistics as favourites, set
statistic alerts) please log in with your personal account.
If you are an admin, please authenticate by logging in again.