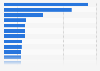
In 2022, about 7.8 percent of all goods imported were agricultural products. The vast majority of United States imports were manufactured commodity products. Further information on U.S. imports can be found on our dedicated topic page here.
Advertisement
Advertisement
Breakdown of imports of goods to the United States in 2022, by main commodity group
Profit from the additional features of your individual account
Currently, you are using a shared account. To use individual functions (e.g., mark statistics as favourites, set
statistic alerts) please log in with your personal account.
If you are an admin, please authenticate by logging in again.
Learn more about how Statista can support your business.
WTO. (October 31, 2023). Breakdown of imports of goods to the United States in 2022, by main commodity group [Graph]. In Statista. Retrieved June 20, 2025, from https://www.statista.com/statistics/259133/breakdown-of-us-imports-of-goods-by-main-commodity-group/
WTO. "Breakdown of imports of goods to the United States in 2022, by main commodity group ." Chart. October 31, 2023. Statista. Accessed June 20, 2025. https://www.statista.com/statistics/259133/breakdown-of-us-imports-of-goods-by-main-commodity-group/
WTO. (2023). Breakdown of imports of goods to the United States in 2022, by main commodity group . Statista. Statista Inc.. Accessed: June 20, 2025. https://www.statista.com/statistics/259133/breakdown-of-us-imports-of-goods-by-main-commodity-group/
WTO. "Breakdown of Imports of Goods to The United States in 2022, by Main Commodity Group ." Statista, Statista Inc., 31 Oct 2023, https://www.statista.com/statistics/259133/breakdown-of-us-imports-of-goods-by-main-commodity-group/
WTO, Breakdown of imports of goods to the United States in 2022, by main commodity group Statista, https://www.statista.com/statistics/259133/breakdown-of-us-imports-of-goods-by-main-commodity-group/ (last visited June 20, 2025)
Breakdown of imports of goods to the United States in 2022, by main commodity group [Graph], WTO, October 31, 2023. [Online]. Available: https://www.statista.com/statistics/259133/breakdown-of-us-imports-of-goods-by-main-commodity-group/