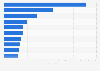
Consumer spending on carry-out orders from quick-service pizza restaurants in the United States peaked at 20.5 billion U.S. dollars in 2024. This figure shows a slight increase over the previous year's total of 20.2 billion. Consumer spending on carry-out pizza in the U.S. previously peaked in 2020 during the coronavirus (COVID-19) pandemic.
Carrying out an analysis of the carryout segment
The pizza category of the quick-service restaurant (QSR) industry is divided into three main segments: delivery, dine-in, and carry-out. Sales from the four leading pizza chains in the United States accounted for the majority of the carry-out segment in 2023. Similarly, the carry-out segment accounted for most of overall consumer spending in quick-service pizza restaurants across the United States.
Carryout orders are deal of the day
Many pizza restaurants have improved their carry-out menu and promote carry-out deals because it is not only a way of cutting costs – delivery drivers are not required – but it also helps to edge out competition from food delivery apps, such as Grubhub and Uber Eats. Domino’s Pizza has been serving customers in the United States since 1960, with a particular focus on delivery; however, the carry-out segment has become a key area of the business in recent years. Many of the company’s stores in the United States are designed with the carry-out customer in mind – for example, special seating areas allow customers to watch their orders being made.
Advertisement
Advertisement
Consumer spending on quick service carry-out pizza in the United States from 2004 to 2024
(in billion U.S. dollars)
Profit from the additional features of your individual account
Currently, you are using a shared account. To use individual functions (e.g., mark statistics as favourites, set
statistic alerts) please log in with your personal account.
If you are an admin, please authenticate by logging in again.
Learn more about how Statista can support your business.
U.S. Securities and Exchange Commission. (February 24, 2025). Consumer spending on quick service carry-out pizza in the United States from 2004 to 2024 (in billion U.S. dollars) [Graph]. In Statista. Retrieved June 24, 2025, from https://www.statista.com/statistics/259173/pizza-carry-out-consumer-spending-in-the-us-qsr/
U.S. Securities and Exchange Commission. "Consumer spending on quick service carry-out pizza in the United States from 2004 to 2024 (in billion U.S. dollars)." Chart. February 24, 2025. Statista. Accessed June 24, 2025. https://www.statista.com/statistics/259173/pizza-carry-out-consumer-spending-in-the-us-qsr/
U.S. Securities and Exchange Commission. (2025). Consumer spending on quick service carry-out pizza in the United States from 2004 to 2024 (in billion U.S. dollars). Statista. Statista Inc.. Accessed: June 24, 2025. https://www.statista.com/statistics/259173/pizza-carry-out-consumer-spending-in-the-us-qsr/
U.S. Securities and Exchange Commission. "Consumer Spending on Quick Service Carry-out Pizza in The United States from 2004 to 2024 (in Billion U.S. Dollars)." Statista, Statista Inc., 24 Feb 2025, https://www.statista.com/statistics/259173/pizza-carry-out-consumer-spending-in-the-us-qsr/
U.S. Securities and Exchange Commission, Consumer spending on quick service carry-out pizza in the United States from 2004 to 2024 (in billion U.S. dollars) Statista, https://www.statista.com/statistics/259173/pizza-carry-out-consumer-spending-in-the-us-qsr/ (last visited June 24, 2025)
Consumer spending on quick service carry-out pizza in the United States from 2004 to 2024 (in billion U.S. dollars) [Graph], U.S. Securities and Exchange Commission, February 24, 2025. [Online]. Available: https://www.statista.com/statistics/259173/pizza-carry-out-consumer-spending-in-the-us-qsr/