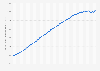
The total borrowings of Navient Corporation generally decreased between 2008 and 2023. After no significant change in the first two years of the time period under observation, the total borrowings of Navient Corp climbed to a value of approximately 197.2 billion U.S. dollars in 2010. Since then, the value of total borrowings decreased year-on-year, amounting to a value of approximately 56 billion U.S. dollars in 2023.
Advertisement
Advertisement
Total borrowings of Navient Corporation from 2008 to 2023
(in billion U.S. dollars)
Profit from the additional features of your individual account
Currently, you are using a shared account. To use individual functions (e.g., mark statistics as favourites, set
statistic alerts) please log in with your personal account.
If you are an admin, please authenticate by logging in again.
Learn more about how Statista can support your business.
Navient. (February 15, 2024). Total borrowings of Navient Corporation from 2008 to 2023 (in billion U.S. dollars) [Graph]. In Statista. Retrieved June 22, 2025, from https://www.statista.com/statistics/259312/total-borrowings-by-sallie-mae-from-2008/
Navient. "Total borrowings of Navient Corporation from 2008 to 2023 (in billion U.S. dollars)." Chart. February 15, 2024. Statista. Accessed June 22, 2025. https://www.statista.com/statistics/259312/total-borrowings-by-sallie-mae-from-2008/
Navient. (2024). Total borrowings of Navient Corporation from 2008 to 2023 (in billion U.S. dollars). Statista. Statista Inc.. Accessed: June 22, 2025. https://www.statista.com/statistics/259312/total-borrowings-by-sallie-mae-from-2008/
Navient. "Total Borrowings of Navient Corporation from 2008 to 2023 (in Billion U.S. Dollars)." Statista, Statista Inc., 15 Feb 2024, https://www.statista.com/statistics/259312/total-borrowings-by-sallie-mae-from-2008/
Navient, Total borrowings of Navient Corporation from 2008 to 2023 (in billion U.S. dollars) Statista, https://www.statista.com/statistics/259312/total-borrowings-by-sallie-mae-from-2008/ (last visited June 22, 2025)
Total borrowings of Navient Corporation from 2008 to 2023 (in billion U.S. dollars) [Graph], Navient, February 15, 2024. [Online]. Available: https://www.statista.com/statistics/259312/total-borrowings-by-sallie-mae-from-2008/