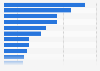
This statistic shows the share of vehicle buyers who reported using various information sources to research vehicles worldwide in 2012. According to Capgemini, 22 percent of respondents in all markets consulted TV advertising to research vehicles.
Advertisement
Advertisement
Vehicle buyers' use of information sources worldwide in 2012, by country
Characteristic
All markets
Mature markets
United States
United Kingdom
France
Germany
Developing markets
Russia
Brazil
India
China
Car dealer (both new and used cars)
56%
63%
64%
64%
61%
64%
49%
39%
57%
52%
47%
Vehicle manufacturer websites
47%
49%
56%
55%
35%
49%
46%
45%
42%
51%
46%
Search engine
39%
32%
32%
36%
27%
35%
46%
52%
34%
48%
51%
Information websites/independent car valuation services
39%
43%
54%
43%
35%
39%
35%
39%
19%
38%
44%
Dealer website
38%
37%
44%
44%
29%
32%
38%
41%
39%
37%
37%
Family and friends
36%
30%
29%
32%
26%
33%
43%
36%
38%
52%
47%
Specialist motoring/automotive press
35%
34%
17%
37%
42%
39%
37%
35%
32%
34%
49%
Web forums, blogs or internet discussion groups
23%
15%
13%
19%
17%
13%
30%
35%
17%
26%
43%
Print advertising
22%
15%
18%
18%
10%
15%
28%
19%
27%
39%
25%
Auto shows
22%
13%
10%
9%
19%
14%
32%
24%
21%
38%
44%
TV advertising
22%
14%
16%
13%
12%
13%
31%
18%
27%
45%
35%
Independent e-tailer sites
19%
18%
11%
13%
14%
34%
19%
21%
11%
20%
24%
Manufacturer or dealer social media page
16%
7%
7%
8%
7%
6%
24%
22%
19%
29%
28%
Add this content to your personal favorites. These can be accessed from the favorites menu in the main navigation.
You have no right to use this feature.
Make sure to contact us if you are interested in scientific citation.
You can upgrade your account to enable this functionality for all statistics.
This feature is not available with your current account.Request access
Learn more about how Statista can support your business.
Capgemini. (March 19, 2013). Vehicle buyers' use of information sources worldwide in 2012, by country [Graph]. In Statista. Retrieved June 23, 2025, from https://www.statista.com/statistics/261147/vehicle-buyers-use-of-information-sources-worldwide-by-region-and-source/
Capgemini. "Vehicle buyers' use of information sources worldwide in 2012, by country." Chart. March 19, 2013. Statista. Accessed June 23, 2025. https://www.statista.com/statistics/261147/vehicle-buyers-use-of-information-sources-worldwide-by-region-and-source/
Capgemini. (2013). Vehicle buyers' use of information sources worldwide in 2012, by country. Statista. Statista Inc.. Accessed: June 23, 2025. https://www.statista.com/statistics/261147/vehicle-buyers-use-of-information-sources-worldwide-by-region-and-source/
Capgemini. "Vehicle Buyers' Use of Information Sources Worldwide in 2012, by Country." Statista, Statista Inc., 19 Mar 2013, https://www.statista.com/statistics/261147/vehicle-buyers-use-of-information-sources-worldwide-by-region-and-source/
Capgemini, Vehicle buyers' use of information sources worldwide in 2012, by country Statista, https://www.statista.com/statistics/261147/vehicle-buyers-use-of-information-sources-worldwide-by-region-and-source/ (last visited June 23, 2025)
Vehicle buyers' use of information sources worldwide in 2012, by country [Graph], Capgemini, March 19, 2013. [Online]. Available: https://www.statista.com/statistics/261147/vehicle-buyers-use-of-information-sources-worldwide-by-region-and-source/
Advertisement
Profit from additional features with an Employee Account
Please create an employee account to be able to mark statistics as favorites.
Then you can access your favorite statistics via the star in the header.
Profit from the additional features of your individual account
Currently, you are using a shared account. To use individual functions (e.g., mark statistics as favourites, set
statistic alerts) please log in with your personal account.
If you are an admin, please authenticate by logging in again.