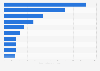
This graph portrays the distribution of Italcementi's revenue in the fiscal year of 2015, by segment. Ready mixed concrete and aggregates contributed almost 1.2 billion euros (or about 1.33 billion U.S. dollars) to the company's revenue.
Profit from the additional features of your individual account
Currently, you are using a shared account. To use individual functions (e.g., mark statistics as favourites, set
statistic alerts) please log in with your personal account.
If you are an admin, please authenticate by logging in again.
Learn more about how Statista can support your business.
Italcementi. (February 18, 2016). Italcementi's revenue in FY 2015, by segment (in million euros/ U.S. dollars) [Graph]. In Statista. Retrieved June 06, 2025, from https://www.statista.com/statistics/262372/revenue-of-italcementi-by-segment/
Italcementi. "Italcementi's revenue in FY 2015, by segment (in million euros/ U.S. dollars)." Chart. February 18, 2016. Statista. Accessed June 06, 2025. https://www.statista.com/statistics/262372/revenue-of-italcementi-by-segment/
Italcementi. (2016). Italcementi's revenue in FY 2015, by segment (in million euros/ U.S. dollars). Statista. Statista Inc.. Accessed: June 06, 2025. https://www.statista.com/statistics/262372/revenue-of-italcementi-by-segment/
Italcementi. "Italcementi's Revenue in Fy 2015, by Segment (in Million Euros/ U.S. Dollars)." Statista, Statista Inc., 18 Feb 2016, https://www.statista.com/statistics/262372/revenue-of-italcementi-by-segment/
Italcementi, Italcementi's revenue in FY 2015, by segment (in million euros/ U.S. dollars) Statista, https://www.statista.com/statistics/262372/revenue-of-italcementi-by-segment/ (last visited June 06, 2025)
Italcementi's revenue in FY 2015, by segment (in million euros/ U.S. dollars) [Graph], Italcementi, February 18, 2016. [Online]. Available: https://www.statista.com/statistics/262372/revenue-of-italcementi-by-segment/