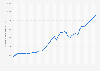
This statistic depicts the age distribution of Canada from 2013 to 2023. In 2023, about 15.3 percent of the population in Canada fell into the 0-14 year category, 65.34 percent into the 15-64 age group and 19.36 percent were over 65 years of age.
Profit from the additional features of your individual account
Currently, you are using a shared account. To use individual functions (e.g., mark statistics as favourites, set
statistic alerts) please log in with your personal account.
If you are an admin, please authenticate by logging in again.
Learn more about how Statista can support your business.
World Bank. (April 15, 2025). Canada: Age distribution from 2013 to 2023 [Graph]. In Statista. Retrieved June 29, 2025, from https://www.statista.com/statistics/266540/age-distribution-in-canada/
World Bank. "Canada: Age distribution from 2013 to 2023." Chart. April 15, 2025. Statista. Accessed June 29, 2025. https://www.statista.com/statistics/266540/age-distribution-in-canada/
World Bank. (2025). Canada: Age distribution from 2013 to 2023. Statista. Statista Inc.. Accessed: June 29, 2025. https://www.statista.com/statistics/266540/age-distribution-in-canada/
World Bank. "Canada: Age Distribution from 2013 to 2023." Statista, Statista Inc., 15 Apr 2025, https://www.statista.com/statistics/266540/age-distribution-in-canada/
World Bank, Canada: Age distribution from 2013 to 2023 Statista, https://www.statista.com/statistics/266540/age-distribution-in-canada/ (last visited June 29, 2025)
Canada: Age distribution from 2013 to 2023 [Graph], World Bank, April 15, 2025. [Online]. Available: https://www.statista.com/statistics/266540/age-distribution-in-canada/