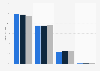
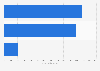
The statistic shows DuPont's revenue distribution. by segment, in 2009 and 2010. In 2009, DuPont's electronics and communication segment generated seven percent of the company's revenue.
Advertisement
Advertisement
Revenue distribution of chemical company DuPont in 2009 and 2010, by segment*
You have no right to use this feature.
Make sure to contact us if you are interested in scientific citation.
You can upgrade your account to enable this functionality for all statistics.
This feature is not available with your current account.Request access
Learn more about how Statista can support your business.
DuPont. (March 1, 2011). Revenue distribution of chemical company DuPont in 2009 and 2010, by segment* [Graph]. In Statista. Retrieved July 08, 2025, from https://www.statista.com/statistics/267328/duponts-revenue-distribution-by-segment/
DuPont. "Revenue distribution of chemical company DuPont in 2009 and 2010, by segment*." Chart. March 1, 2011. Statista. Accessed July 08, 2025. https://www.statista.com/statistics/267328/duponts-revenue-distribution-by-segment/
DuPont. (2011). Revenue distribution of chemical company DuPont in 2009 and 2010, by segment*. Statista. Statista Inc.. Accessed: July 08, 2025. https://www.statista.com/statistics/267328/duponts-revenue-distribution-by-segment/
DuPont. "Revenue Distribution of Chemical Company Dupont in 2009 and 2010, by Segment*." Statista, Statista Inc., 1 Mar 2011, https://www.statista.com/statistics/267328/duponts-revenue-distribution-by-segment/
DuPont, Revenue distribution of chemical company DuPont in 2009 and 2010, by segment* Statista, https://www.statista.com/statistics/267328/duponts-revenue-distribution-by-segment/ (last visited July 08, 2025)
Revenue distribution of chemical company DuPont in 2009 and 2010, by segment* [Graph], DuPont, March 1, 2011. [Online]. Available: https://www.statista.com/statistics/267328/duponts-revenue-distribution-by-segment/
Advertisement
Profit from additional features with an Employee Account
Please create an employee account to be able to mark statistics as favorites.
Then you can access your favorite statistics via the star in the header.
Profit from the additional features of your individual account
Currently, you are using a shared account. To use individual functions (e.g., mark statistics as favourites, set
statistic alerts) please log in with your personal account.
If you are an admin, please authenticate by logging in again.