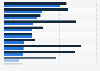
The statistic reflects the change in results of arms company Northrop Grumman from 2002 to 2010. The profit in 2003 amounted to 771 million U.S. dollars.
Profit from the additional features of your individual account
Currently, you are using a shared account. To use individual functions (e.g., mark statistics as favourites, set
statistic alerts) please log in with your personal account.
If you are an admin, please authenticate by logging in again.
Learn more about how Statista can support your business.
Northrop Grumman. (March 31, 2011). Change in the results of Northrop Grumman from 2002 to 2010 (in million U.S. dollars) [Graph]. In Statista. Retrieved June 06, 2025, from https://www.statista.com/statistics/268957/change-in-annual-results-of-northrop-grumman/
Northrop Grumman. "Change in the results of Northrop Grumman from 2002 to 2010 (in million U.S. dollars)." Chart. March 31, 2011. Statista. Accessed June 06, 2025. https://www.statista.com/statistics/268957/change-in-annual-results-of-northrop-grumman/
Northrop Grumman. (2011). Change in the results of Northrop Grumman from 2002 to 2010 (in million U.S. dollars). Statista. Statista Inc.. Accessed: June 06, 2025. https://www.statista.com/statistics/268957/change-in-annual-results-of-northrop-grumman/
Northrop Grumman. "Change in The Results of Northrop Grumman from 2002 to 2010 (in Million U.S. Dollars)." Statista, Statista Inc., 31 Mar 2011, https://www.statista.com/statistics/268957/change-in-annual-results-of-northrop-grumman/
Northrop Grumman, Change in the results of Northrop Grumman from 2002 to 2010 (in million U.S. dollars) Statista, https://www.statista.com/statistics/268957/change-in-annual-results-of-northrop-grumman/ (last visited June 06, 2025)
Change in the results of Northrop Grumman from 2002 to 2010 (in million U.S. dollars) [Graph], Northrop Grumman, March 31, 2011. [Online]. Available: https://www.statista.com/statistics/268957/change-in-annual-results-of-northrop-grumman/