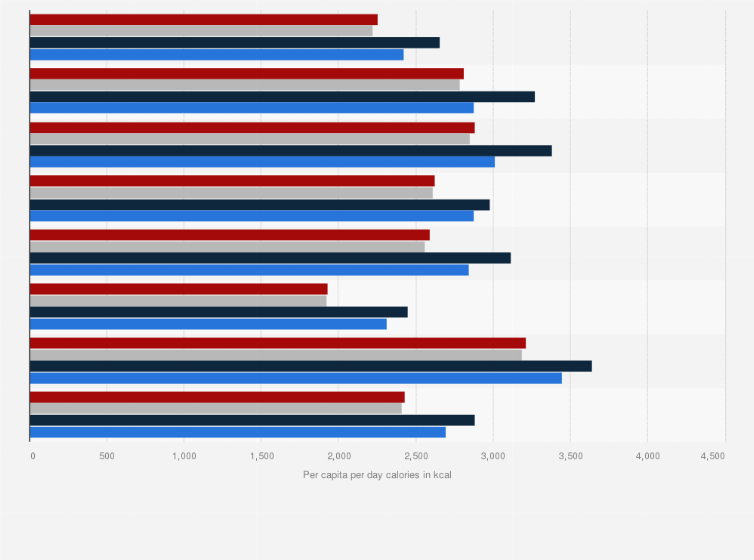
Shown is the per capita calorie availability in 2000 and forecasts for 2050, by world region. The first set of estimates do not take climate change into the account, the other two are based on estimates by two different research bodies on how climate change will affect calorie availability. In 2000, 2424 kcal per day and per capita were available in the South Asia region.
Advertisement
Advertisement
Daily per capita calorie availability with and without climate change in 2000 and 2050, by world region,
(in kcal per day)
Adjust the presentation of the statistic and data points.
Share the statistic on social media channels or embed the statistic in your
website using "Embed Code", where available.
Cite this statistic and select one of the following formats: APA, Chicago, Harvard, MLA & Bluebook.
Print the statistic including description and metadata.
Chart type
Daily per capita calorie availability with and without climate change in 2000 and 2050, by world region,
Share this statistic
You have no right to use this feature.
Make sure to contact us if you are interested in scientific citation.
You can upgrade your account to enable this functionality for all statistics.
This feature is not available with your current account.Request access
CSIRO = Commonwealth Scientific and Industrial Research Organisation NCAR = National Center for Atmospheric Research * Climate change, without CO2 fertilization.
Learn more about how Statista can support your business.
International Food Policy Research Institute. (October 1, 2009). Daily per capita calorie availability with and without climate change in 2000 and 2050, by world region, (in kcal per day) [Graph]. In Statista. Retrieved June 26, 2025, from https://www.statista.com/statistics/269128/per-capita-availability-of-calories-according-to-world-region/
International Food Policy Research Institute. "Daily per capita calorie availability with and without climate change in 2000 and 2050, by world region, (in kcal per day)." Chart. October 1, 2009. Statista. Accessed June 26, 2025. https://www.statista.com/statistics/269128/per-capita-availability-of-calories-according-to-world-region/
International Food Policy Research Institute. (2009). Daily per capita calorie availability with and without climate change in 2000 and 2050, by world region, (in kcal per day). Statista. Statista Inc.. Accessed: June 26, 2025. https://www.statista.com/statistics/269128/per-capita-availability-of-calories-according-to-world-region/
International Food Policy Research Institute. "Daily per Capita Calorie Availability with and without Climate Change in 2000 and 2050, by World Region, (in Kcal per Day)." Statista, Statista Inc., 1 Oct 2009, https://www.statista.com/statistics/269128/per-capita-availability-of-calories-according-to-world-region/
International Food Policy Research Institute, Daily per capita calorie availability with and without climate change in 2000 and 2050, by world region, (in kcal per day) Statista, https://www.statista.com/statistics/269128/per-capita-availability-of-calories-according-to-world-region/ (last visited June 26, 2025)
Daily per capita calorie availability with and without climate change in 2000 and 2050, by world region, (in kcal per day) [Graph], International Food Policy Research Institute, October 1, 2009. [Online]. Available: https://www.statista.com/statistics/269128/per-capita-availability-of-calories-according-to-world-region/
Advertisement
Profit from additional features with an Employee Account
Please create an employee account to be able to mark statistics as favorites.
Then you can access your favorite statistics via the star in the header.
Profit from the additional features of your individual account
Currently, you are using a shared account. To use individual functions (e.g., mark statistics as favourites, set
statistic alerts) please log in with your personal account.
If you are an admin, please authenticate by logging in again.