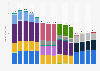
This statistic shows the revenue generated by server vendors in the EMEA region from the third quarter of 2009 to the latest quarter. In the third quarter of 2018, HPE achieved revenues of around 1.18 billion U.S. dollars.
Advertisement
Advertisement
Quarterly server revenue in Europe, the Middle East, and Africa (EMEA) from 2009 to 2018, by vendor
(in million U.S. dollars)
Profit from the additional features of your individual account
Currently, you are using a shared account. To use individual functions (e.g., mark statistics as favourites, set
statistic alerts) please log in with your personal account.
If you are an admin, please authenticate by logging in again.
Learn more about how Statista can support your business.
IDC. (December 21, 2018). Quarterly server revenue in Europe, the Middle East, and Africa (EMEA) from 2009 to 2018, by vendor (in million U.S. dollars) [Graph]. In Statista. Retrieved June 20, 2025, from https://www.statista.com/statistics/269391/server-systems-factory-revenue-in-emea-since-2009-by-corporate-family/
IDC. "Quarterly server revenue in Europe, the Middle East, and Africa (EMEA) from 2009 to 2018, by vendor (in million U.S. dollars)." Chart. December 21, 2018. Statista. Accessed June 20, 2025. https://www.statista.com/statistics/269391/server-systems-factory-revenue-in-emea-since-2009-by-corporate-family/
IDC. (2018). Quarterly server revenue in Europe, the Middle East, and Africa (EMEA) from 2009 to 2018, by vendor (in million U.S. dollars). Statista. Statista Inc.. Accessed: June 20, 2025. https://www.statista.com/statistics/269391/server-systems-factory-revenue-in-emea-since-2009-by-corporate-family/
IDC. "Quarterly Server Revenue in Europe, The Middle East, and Africa (Emea) from 2009 to 2018, by Vendor (in Million U.S. Dollars)." Statista, Statista Inc., 21 Dec 2018, https://www.statista.com/statistics/269391/server-systems-factory-revenue-in-emea-since-2009-by-corporate-family/
IDC, Quarterly server revenue in Europe, the Middle East, and Africa (EMEA) from 2009 to 2018, by vendor (in million U.S. dollars) Statista, https://www.statista.com/statistics/269391/server-systems-factory-revenue-in-emea-since-2009-by-corporate-family/ (last visited June 20, 2025)
Quarterly server revenue in Europe, the Middle East, and Africa (EMEA) from 2009 to 2018, by vendor (in million U.S. dollars) [Graph], IDC, December 21, 2018. [Online]. Available: https://www.statista.com/statistics/269391/server-systems-factory-revenue-in-emea-since-2009-by-corporate-family/