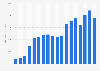
In 2022, Activision Blizzard's console segment generated 1.75 billion U.S. dollars in annual revenues. This represents a 34 percent year over-year decrease. Console gaming accounts for approximately 23 percent of Activision Blizzard's annual revenue.
Advertisement
Advertisement
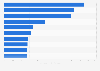
Net revenue generated by Activision Blizzard from 2015 to 2022, by platform
(in million U.S. dollars)
Characteristic
Consoles
PC*
Mobile and ancillary**
Other
2022
1,753
1,653
3,517
605
2021
2,637
2,323
3,182
661
2020
2,784
2,056
2,559
687
2019
1,920
1,718
2,203
648
2018
2,538
2,180
2,175
607
2017
2,389
2,042
2,081
505
2016
2,453
2,124
1,674
357
2015
2,391
1,499
418
356
02,0004,0006,0008,00010,000
Add this content to your personal favorites. These can be accessed from the favorites menu in the main navigation.
You have no right to use this feature.
Make sure to contact us if you are interested in scientific citation.
You can upgrade your account to enable this functionality for all statistics.
This feature is not available with your current account.Request access
*Net revenues from PC include revenues that were historically shown as Online. Revenues from online consists of revenues from all World of Warcraft products, including subscriptions, boxed products, expansion packs, licensing royalties, and value-added services.
**Revenues from mobile and ancillary include revenues from handheld, mobile and tablet devices, as well as non-platform specific game related revenues such as standalone sales of toys and accessories products from the Skylanders franchise and other physical merchandise and accessories.
Net revenues from Other include revenues from Major League Gaming, studios and distribution businesses.
Learn more about how Statista can support your business.
Activision Blizzard. (February 6, 2023). Net revenue generated by Activision Blizzard from 2015 to 2022, by platform (in million U.S. dollars) [Graph]. In Statista. Retrieved June 16, 2025, from https://www.statista.com/statistics/269667/activision-blizzards-revenue-by-platform/
Activision Blizzard. "Net revenue generated by Activision Blizzard from 2015 to 2022, by platform (in million U.S. dollars)." Chart. February 6, 2023. Statista. Accessed June 16, 2025. https://www.statista.com/statistics/269667/activision-blizzards-revenue-by-platform/
Activision Blizzard. (2023). Net revenue generated by Activision Blizzard from 2015 to 2022, by platform (in million U.S. dollars). Statista. Statista Inc.. Accessed: June 16, 2025. https://www.statista.com/statistics/269667/activision-blizzards-revenue-by-platform/
Activision Blizzard. "Net Revenue Generated by Activision Blizzard from 2015 to 2022, by Platform (in Million U.S. Dollars)." Statista, Statista Inc., 6 Feb 2023, https://www.statista.com/statistics/269667/activision-blizzards-revenue-by-platform/
Activision Blizzard, Net revenue generated by Activision Blizzard from 2015 to 2022, by platform (in million U.S. dollars) Statista, https://www.statista.com/statistics/269667/activision-blizzards-revenue-by-platform/ (last visited June 16, 2025)
Net revenue generated by Activision Blizzard from 2015 to 2022, by platform (in million U.S. dollars) [Graph], Activision Blizzard, February 6, 2023. [Online]. Available: https://www.statista.com/statistics/269667/activision-blizzards-revenue-by-platform/
Advertisement
Profit from additional features with an Employee Account
Please create an employee account to be able to mark statistics as favorites.
Then you can access your favorite statistics via the star in the header.
Profit from the additional features of your individual account
Currently, you are using a shared account. To use individual functions (e.g., mark statistics as favourites, set
statistic alerts) please log in with your personal account.
If you are an admin, please authenticate by logging in again.