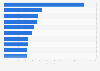
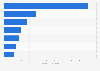
This graph depicts the percentage distribution of the total global gate revenue from sporting events by region from 2009 to 2012. In 2010, the share of the Asia / Pacific region of the global sports gate revenues was 14.36 percent.
Profit from the additional features of your individual account
Currently, you are using a shared account. To use individual functions (e.g., mark statistics as favourites, set
statistic alerts) please log in with your personal account.
If you are an admin, please authenticate by logging in again.
Learn more about how Statista can support your business.
PwC. (December 12, 2011). Sports gate revenue share by region worldwide from 2009 to 2012* [Graph]. In Statista. Retrieved May 17, 2025, from https://www.statista.com/statistics/269792/regional-share-of-worldwide-sports-gate-revenue/
PwC. "Sports gate revenue share by region worldwide from 2009 to 2012*." Chart. December 12, 2011. Statista. Accessed May 17, 2025. https://www.statista.com/statistics/269792/regional-share-of-worldwide-sports-gate-revenue/
PwC. (2011). Sports gate revenue share by region worldwide from 2009 to 2012*. Statista. Statista Inc.. Accessed: May 17, 2025. https://www.statista.com/statistics/269792/regional-share-of-worldwide-sports-gate-revenue/
PwC. "Sports Gate Revenue Share by Region Worldwide from 2009 to 2012*." Statista, Statista Inc., 12 Dec 2011, https://www.statista.com/statistics/269792/regional-share-of-worldwide-sports-gate-revenue/
PwC, Sports gate revenue share by region worldwide from 2009 to 2012* Statista, https://www.statista.com/statistics/269792/regional-share-of-worldwide-sports-gate-revenue/ (last visited May 17, 2025)
Sports gate revenue share by region worldwide from 2009 to 2012* [Graph], PwC, December 12, 2011. [Online]. Available: https://www.statista.com/statistics/269792/regional-share-of-worldwide-sports-gate-revenue/