In 2023, there were around 27.4 million households in the United Kingdom (UK) that had televisions, a number that has continued to grow annually since 2013. In the UK, the average consumer spent 158 minutes per day watching TV in 2022, with those aged over 65 years spending the most time in front of the box. Compared to other European countries, UK viewers spent less than the average watching TV.
Leading stations
As of 2022/2023, BBC One had a reach of 55 percent. Unsurprisingly, the British Broadcasting Corporation (BBC) had the highest audience share of UK TV broadcasters.
Smart TV
It is now very hard to purchase a new television in the UK without it being smart. As of 2023, the household penetration rate of smart TV sets was over 70 percent. Essentially, a smart television is a TV that has a connection to the internet. This then allows viewers to have access to streaming brands such as Netflix, Amazon, and Hulu through their TV set.
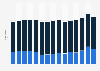
Total number of TV households in the United Kingdom from 2013 to 2023
(in millions)
Characteristic
Households in millions
2023
27.4
2022
27.3
2021
27.2
2020
27
2019
26.9
2018
26.8
2017
26.7
2016
26.7
2015
26.7
2014
26.4
2013
26.3
26.226.426.626.82727.227.427.6
Add this content to your personal favorites. These can be accessed from the favorites menu in the main navigation.
You have no right to use this feature.
Make sure to contact us if you are interested in scientific citation.
You can upgrade your account to enable this functionality for all statistics.
This feature is not available with your current account.Request access
Learn more about how Statista can support your business.
IVF. (August 14, 2024). Total number of TV households in the United Kingdom from 2013 to 2023 (in millions) [Graph]. In Statista. Retrieved May 13, 2025, from https://www.statista.com/statistics/269969/number-of-tv-households-in-the-uk/
IVF. "Total number of TV households in the United Kingdom from 2013 to 2023 (in millions)." Chart. August 14, 2024. Statista. Accessed May 13, 2025. https://www.statista.com/statistics/269969/number-of-tv-households-in-the-uk/
IVF. (2024). Total number of TV households in the United Kingdom from 2013 to 2023 (in millions). Statista. Statista Inc.. Accessed: May 13, 2025. https://www.statista.com/statistics/269969/number-of-tv-households-in-the-uk/
IVF. "Total Number of Tv Households in The United Kingdom from 2013 to 2023 (in Millions)." Statista, Statista Inc., 14 Aug 2024, https://www.statista.com/statistics/269969/number-of-tv-households-in-the-uk/
IVF, Total number of TV households in the United Kingdom from 2013 to 2023 (in millions) Statista, https://www.statista.com/statistics/269969/number-of-tv-households-in-the-uk/ (last visited May 13, 2025)
Total number of TV households in the United Kingdom from 2013 to 2023 (in millions) [Graph], IVF, August 14, 2024. [Online]. Available: https://www.statista.com/statistics/269969/number-of-tv-households-in-the-uk/
Profit from additional features with an Employee Account
Please create an employee account to be able to mark statistics as favorites.
Then you can access your favorite statistics via the star in the header.
Profit from the additional features of your individual account
Currently, you are using a shared account. To use individual functions (e.g., mark statistics as favourites, set
statistic alerts) please log in with your personal account.
If you are an admin, please authenticate by logging in again.