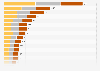
This graph depicts the Olympic marketing revenues generated through ticketing from 1993 to 2016. In the quadrennium from 2013 to 2016, marketing revenues from ticketing amounted to 527 million U.S. dollars.
Advertisement
Advertisement
Olympic Games ticketing revenue from 1993 to 2016
(in million U.S. dollars)
Profit from the additional features of your individual account
Currently, you are using a shared account. To use individual functions (e.g., mark statistics as favourites, set
statistic alerts) please log in with your personal account.
If you are an admin, please authenticate by logging in again.
Learn more about how Statista can support your business.
IOC. (January 24, 2020). Olympic Games ticketing revenue from 1993 to 2016 (in million U.S. dollars) [Graph]. In Statista. Retrieved June 23, 2025, from https://www.statista.com/statistics/274450/revenue-of-olympic-games-from-ticketing/
IOC. "Olympic Games ticketing revenue from 1993 to 2016 (in million U.S. dollars)." Chart. January 24, 2020. Statista. Accessed June 23, 2025. https://www.statista.com/statistics/274450/revenue-of-olympic-games-from-ticketing/
IOC. (2020). Olympic Games ticketing revenue from 1993 to 2016 (in million U.S. dollars). Statista. Statista Inc.. Accessed: June 23, 2025. https://www.statista.com/statistics/274450/revenue-of-olympic-games-from-ticketing/
IOC. "Olympic Games Ticketing Revenue from 1993 to 2016 (in Million U.S. Dollars)." Statista, Statista Inc., 24 Jan 2020, https://www.statista.com/statistics/274450/revenue-of-olympic-games-from-ticketing/
IOC, Olympic Games ticketing revenue from 1993 to 2016 (in million U.S. dollars) Statista, https://www.statista.com/statistics/274450/revenue-of-olympic-games-from-ticketing/ (last visited June 23, 2025)
Olympic Games ticketing revenue from 1993 to 2016 (in million U.S. dollars) [Graph], IOC, January 24, 2020. [Online]. Available: https://www.statista.com/statistics/274450/revenue-of-olympic-games-from-ticketing/