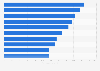
The statistic presents information on preferred TV show genres among adults in the United States as of November 2018. The findings show that 88 percent of respondents said that they found comedies to be very or somewhat favorable, however just 53 percent said the same about the horror genre. The least favorable TV show type was reality, with just 45 percent having a favorable impression of reality television shows.
Advertisement
Advertisement
Favorability of selected television show genres among adults in the United States as of November 2018
*The total sample size was 2,200 adults. The data reflects those who considered the genre very or somewhat favorable.
Question: "Do you have a favorable or unfavorable impression of the following television show genres?"
Profit from the additional features of your individual account
Currently, you are using a shared account. To use individual functions (e.g., mark statistics as favourites, set
statistic alerts) please log in with your personal account.
If you are an admin, please authenticate by logging in again.
Learn more about how Statista can support your business.
Morning Consult. (November 27, 2018). Favorability of selected television show genres among adults in the United States as of November 2018 [Graph]. In Statista. Retrieved June 19, 2025, from https://www.statista.com/statistics/275121/preferred-tv-show-types-in-the-us/
Morning Consult. "Favorability of selected television show genres among adults in the United States as of November 2018." Chart. November 27, 2018. Statista. Accessed June 19, 2025. https://www.statista.com/statistics/275121/preferred-tv-show-types-in-the-us/
Morning Consult. (2018). Favorability of selected television show genres among adults in the United States as of November 2018. Statista. Statista Inc.. Accessed: June 19, 2025. https://www.statista.com/statistics/275121/preferred-tv-show-types-in-the-us/
Morning Consult. "Favorability of Selected Television Show Genres among Adults in The United States as of November 2018." Statista, Statista Inc., 27 Nov 2018, https://www.statista.com/statistics/275121/preferred-tv-show-types-in-the-us/
Morning Consult, Favorability of selected television show genres among adults in the United States as of November 2018 Statista, https://www.statista.com/statistics/275121/preferred-tv-show-types-in-the-us/ (last visited June 19, 2025)
Favorability of selected television show genres among adults in the United States as of November 2018 [Graph], Morning Consult, November 27, 2018. [Online]. Available: https://www.statista.com/statistics/275121/preferred-tv-show-types-in-the-us/