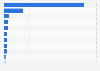
In 2023, Barrick realized an average gold price of 1,948 U.S. dollars per ounce, which was a higher price compared with the previous year.
Barrick Gold is a Canada-based company and is one of the largest pure gold mining companies worldwide. Barrick's average realized gold price per ounce is in tandem with average global gold prices.
Average realized gold price per ounce of Barrick Gold from 2010 to 2023
(in U.S. dollars)
Characteristic
Price in U.S. dollars per ounce
2023
1,948
2022
1,795
2021
1,790
2020
1,778
2019
1,396
2018
1,270
2017
1,258
2016
1,248
2015
1,157
2014
1,265
2013
1,407
2012
1,669
2011
1,578
05001,0001,5002,0002,500
Add this content to your personal favorites. These can be accessed from the favorites menu in the main navigation.
You have no right to use this feature.
Make sure to contact us if you are interested in scientific citation.
You can upgrade your account to enable this functionality for all statistics.
This feature is not available with your current account.Request access
Learn more about how Statista can support your business.
Barrick Gold. (March 20, 2024). Average realized gold price per ounce of Barrick Gold from 2010 to 2023 (in U.S. dollars) [Graph]. In Statista. Retrieved May 09, 2025, from https://www.statista.com/statistics/277238/barrick-golds-average-realized-gold-price/
Barrick Gold. "Average realized gold price per ounce of Barrick Gold from 2010 to 2023 (in U.S. dollars)." Chart. March 20, 2024. Statista. Accessed May 09, 2025. https://www.statista.com/statistics/277238/barrick-golds-average-realized-gold-price/
Barrick Gold. (2024). Average realized gold price per ounce of Barrick Gold from 2010 to 2023 (in U.S. dollars). Statista. Statista Inc.. Accessed: May 09, 2025. https://www.statista.com/statistics/277238/barrick-golds-average-realized-gold-price/
Barrick Gold. "Average Realized Gold Price per Ounce of Barrick Gold from 2010 to 2023 (in U.S. Dollars)." Statista, Statista Inc., 20 Mar 2024, https://www.statista.com/statistics/277238/barrick-golds-average-realized-gold-price/
Barrick Gold, Average realized gold price per ounce of Barrick Gold from 2010 to 2023 (in U.S. dollars) Statista, https://www.statista.com/statistics/277238/barrick-golds-average-realized-gold-price/ (last visited May 09, 2025)
Average realized gold price per ounce of Barrick Gold from 2010 to 2023 (in U.S. dollars) [Graph], Barrick Gold, March 20, 2024. [Online]. Available: https://www.statista.com/statistics/277238/barrick-golds-average-realized-gold-price/
Profit from additional features with an Employee Account
Please create an employee account to be able to mark statistics as favorites.
Then you can access your favorite statistics via the star in the header.
Profit from the additional features of your individual account
Currently, you are using a shared account. To use individual functions (e.g., mark statistics as favourites, set
statistic alerts) please log in with your personal account.
If you are an admin, please authenticate by logging in again.