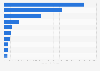
The graph shows the expenditure on cosmetics by Chinese consumers in 2009 and 2012, by location. In 2009, three percent of Chinese consumers purchased cosmetics in Europe.
Where did you purchase your cosmetics in the last 12 months?
Profit from the additional features of your individual account
Currently, you are using a shared account. To use individual functions (e.g., mark statistics as favourites, set
statistic alerts) please log in with your personal account.
If you are an admin, please authenticate by logging in again.
Learn more about how Statista can support your business.
KPMG. (January 29, 2013). Where did you purchase your cosmetics in the last 12 months? [Graph]. In Statista. Retrieved May 24, 2025, from https://www.statista.com/statistics/279046/china-cosmetics-spend-by-location/
KPMG. "Where did you purchase your cosmetics in the last 12 months?." Chart. January 29, 2013. Statista. Accessed May 24, 2025. https://www.statista.com/statistics/279046/china-cosmetics-spend-by-location/
KPMG. (2013). Where did you purchase your cosmetics in the last 12 months?. Statista. Statista Inc.. Accessed: May 24, 2025. https://www.statista.com/statistics/279046/china-cosmetics-spend-by-location/
KPMG. "Where Did You Purchase Your Cosmetics in The Last 12 Months?." Statista, Statista Inc., 29 Jan 2013, https://www.statista.com/statistics/279046/china-cosmetics-spend-by-location/
KPMG, Where did you purchase your cosmetics in the last 12 months? Statista, https://www.statista.com/statistics/279046/china-cosmetics-spend-by-location/ (last visited May 24, 2025)
Where did you purchase your cosmetics in the last 12 months? [Graph], KPMG, January 29, 2013. [Online]. Available: https://www.statista.com/statistics/279046/china-cosmetics-spend-by-location/