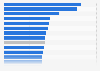
In 2023, the total number of taxis in China amounted to around 1.37 million units. In the same year, the highest number of taxis were recorded in Heilongjiang province, with 98,021 units. In contrast, only 2,380 cabs were in use in Tibet.
Number of taxi cabs in Chinese cities in 2023, by region
Profit from the additional features of your individual account
Currently, you are using a shared account. To use individual functions (e.g., mark statistics as favourites, set
statistic alerts) please log in with your personal account.
If you are an admin, please authenticate by logging in again.
Learn more about how Statista can support your business.
National Bureau of Statistics of China. (October 15, 2024). Number of taxi cabs in Chinese cities in 2023, by region [Graph]. In Statista. Retrieved May 06, 2025, from https://www.statista.com/statistics/279082/number-of-taxi-cabs-in-china-by-region/
National Bureau of Statistics of China. "Number of taxi cabs in Chinese cities in 2023, by region." Chart. October 15, 2024. Statista. Accessed May 06, 2025. https://www.statista.com/statistics/279082/number-of-taxi-cabs-in-china-by-region/
National Bureau of Statistics of China. (2024). Number of taxi cabs in Chinese cities in 2023, by region. Statista. Statista Inc.. Accessed: May 06, 2025. https://www.statista.com/statistics/279082/number-of-taxi-cabs-in-china-by-region/
National Bureau of Statistics of China. "Number of Taxi Cabs in Chinese Cities in 2023, by Region." Statista, Statista Inc., 15 Oct 2024, https://www.statista.com/statistics/279082/number-of-taxi-cabs-in-china-by-region/
National Bureau of Statistics of China, Number of taxi cabs in Chinese cities in 2023, by region Statista, https://www.statista.com/statistics/279082/number-of-taxi-cabs-in-china-by-region/ (last visited May 06, 2025)
Number of taxi cabs in Chinese cities in 2023, by region [Graph], National Bureau of Statistics of China, October 15, 2024. [Online]. Available: https://www.statista.com/statistics/279082/number-of-taxi-cabs-in-china-by-region/