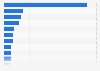
The statistic shows the purchase of soft drinks in China in 2013, by income group. That year, 54 percent of respondents belonging to the 'up to 2,000 yuan' income group had bought soft drinks in the three months prior to the survey.
Purchase of soft drinks in China in 2013, by income group
Profit from the additional features of your individual account
Currently, you are using a shared account. To use individual functions (e.g., mark statistics as favourites, set
statistic alerts) please log in with your personal account.
If you are an admin, please authenticate by logging in again.
Learn more about how Statista can support your business.
Credit Suisse. (February 10, 2014). Purchase of soft drinks in China in 2013, by income group [Graph]. In Statista. Retrieved May 04, 2025, from https://www.statista.com/statistics/279283/purchase-of-soft-drinks-in-china-by-income-group/
Credit Suisse. "Purchase of soft drinks in China in 2013, by income group." Chart. February 10, 2014. Statista. Accessed May 04, 2025. https://www.statista.com/statistics/279283/purchase-of-soft-drinks-in-china-by-income-group/
Credit Suisse. (2014). Purchase of soft drinks in China in 2013, by income group. Statista. Statista Inc.. Accessed: May 04, 2025. https://www.statista.com/statistics/279283/purchase-of-soft-drinks-in-china-by-income-group/
Credit Suisse. "Purchase of Soft Drinks in China in 2013, by Income Group." Statista, Statista Inc., 10 Feb 2014, https://www.statista.com/statistics/279283/purchase-of-soft-drinks-in-china-by-income-group/
Credit Suisse, Purchase of soft drinks in China in 2013, by income group Statista, https://www.statista.com/statistics/279283/purchase-of-soft-drinks-in-china-by-income-group/ (last visited May 04, 2025)
Purchase of soft drinks in China in 2013, by income group [Graph], Credit Suisse, February 10, 2014. [Online]. Available: https://www.statista.com/statistics/279283/purchase-of-soft-drinks-in-china-by-income-group/