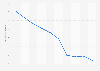
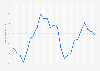
As of the first quarter of 2025, the average weekly number of hours worked by full-time workers in the United Kingdom was 36.5 hours. During this period, there is a dramatic drop observable in 2020, when the average number of working hours fell sharply due to the impact of the COVID-19 pandemic.
Advertisement
Advertisement
Average weekly hours of work for full-time workers in the United Kingdom from 1st quarter 2000 to 1st quarter 2025
Characteristic
Average weekly hours
Q2 2025
-
Q1 2025
36.5
Q4 2024
36.5
Q3 2024
36.9
Q2 2024
36.6
Q1 2024
36.6
Q4 2023
36.4
Q3 2023
36.2
Q2 2023
36.5
Q1 2023
36.5
Q4 2022
36.4
Q3 2022
36.3
Q2 2022
36.3
Q1 2022
36.5
Q4 2021
36.3
Q3 2021
36.1
Q2 2021
35.5
Q1 2021
34
Q4 2020
34.9
Q3 2020
32.8
Q2 2020
30.4
Q1 2020
36.3
Q4 2019
36.9
Q3 2019
37.2
Q2 2019
37.3
Q1 2019
37.6
Q4 2018
37.1
Q3 2018
37.3
Q2 2018
37.1
Q1 2018
37.1
Q4 2017
37.2
Q3 2017
37.3
Q2 2017
37.6
Q1 2017
37.5
Q4 2016
37.5
Q3 2016
37.4
Q2 2016
37.4
Q1 2016
37.6
Q4 2015
37.7
Q3 2015
37.3
Q2 2015
37.4
Q1 2015
37.4
Q4 2014
37.6
Q3 2014
37.6
Q2 2014
37.7
Q1 2014
37.5
Q4 2013
37.5
Q3 2013
37.7
Q2 2013
37.5
Q1 2013
37.5
Q4 2012
37.4
Q3 2012
37.6
Q2 2012
37.2
Q1 2012
37.3
Q4 2011
37.1
Q3 2011
37.1
Q2 2011
36.7
Q1 2011
37.2
Q4 2010
37.4
Q3 2010
37
Q2 2010
37
Q1 2010
37
Q4 2009
36.8
Q3 2009
36.8
Q2 2009
36.9
Q1 2009
36.6
Q4 2008
37
Q3 2008
37.1
Q2 2008
36.9
Q1 2008
37.4
Q4 2007
37
Q3 2007
37.2
Q2 2007
37.3
Q1 2007
37.3
Q4 2006
37.2
Q3 2006
37.1
Q2 2006
37.1
Q1 2006
37.2
Q4 2005
37.3
Q3 2005
37.3
Q2 2005
37.2
Q1 2005
37.3
Q4 2004
37.5
Q3 2004
37.2
Q2 2004
37.2
Q1 2004
37.4
Q4 2003
37.2
Q3 2003
37.4
Q2 2003
37.4
Q1 2003
37.5
Q4 2002
37.3
Q3 2002
37.7
Q2 2002
37.4
Q1 2002
37.7
Q4 2001
37.7
Q3 2001
37.9
Q2 2001
38
Q1 2001
37.9
Q4 2000
38.1
Q3 2000
37.9
Q2 2000
38
Q1 2000
37.6
Zoomable Statistic: Select the range in the chart you want to zoom in on.
Profit from the additional features of your individual account
Currently, you are using a shared account. To use individual functions (e.g., mark statistics as favourites, set
statistic alerts) please log in with your personal account.
If you are an admin, please authenticate by logging in again.
Learn more about how Statista can support your business.
Office for National Statistics (UK). (May 13, 2025). Average weekly hours of work for full-time workers in the United Kingdom from 1st quarter 2000 to 1st quarter 2025 [Graph]. In Statista. Retrieved July 25, 2025, from https://www.statista.com/statistics/280763/average-working-hours-uk/
Office for National Statistics (UK). "Average weekly hours of work for full-time workers in the United Kingdom from 1st quarter 2000 to 1st quarter 2025." Chart. May 13, 2025. Statista. Accessed July 25, 2025. https://www.statista.com/statistics/280763/average-working-hours-uk/
Office for National Statistics (UK). (2025). Average weekly hours of work for full-time workers in the United Kingdom from 1st quarter 2000 to 1st quarter 2025. Statista. Statista Inc.. Accessed: July 25, 2025. https://www.statista.com/statistics/280763/average-working-hours-uk/
Office for National Statistics (UK). "Average Weekly Hours of Work for Full-time Workers in The United Kingdom from 1st Quarter 2000 to 1st Quarter 2025." Statista, Statista Inc., 13 May 2025, https://www.statista.com/statistics/280763/average-working-hours-uk/
Office for National Statistics (UK), Average weekly hours of work for full-time workers in the United Kingdom from 1st quarter 2000 to 1st quarter 2025 Statista, https://www.statista.com/statistics/280763/average-working-hours-uk/ (last visited July 25, 2025)
Average weekly hours of work for full-time workers in the United Kingdom from 1st quarter 2000 to 1st quarter 2025 [Graph], Office for National Statistics (UK), May 13, 2025. [Online]. Available: https://www.statista.com/statistics/280763/average-working-hours-uk/