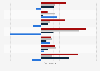
This statistic shows the total factor productivity (TFP) of all sectors of the food supply chain in the United Kingdom (UK) from 2000 to 2016. Over this period, TFP has only fluctuated slightly, with the index level measuring at 106 in 2016. Productivity measures the efficiency at which inputs are converted into outputs. TFP provides a comprehensive picture of growth, and is measured here by index number (with 2000 equalling 100).
Advertisement
Advertisement
Total factor productivity (TFP) trends of the whole food sector supply chain in the United Kingdom (UK) from 2000 to 2016
(index based)
Characteristic
Index*
2016
106
2015
104
2014
104
2013
106
2012
105
2011
105
2010
105
2009
103
2008
105
2007
103
2006
103
2005
101
2004
102
020406080100120
Add this content to your personal favorites. These can be accessed from the favorites menu in the main navigation.
You have no right to use this feature.
Make sure to contact us if you are interested in scientific citation.
You can upgrade your account to enable this functionality for all statistics.
This feature is not available with your current account.Request access
Learn more about how Statista can support your business.
Defra, & GOV.UK. (January 25, 2018). Total factor productivity (TFP) trends of the whole food sector supply chain in the United Kingdom (UK) from 2000 to 2016 (index based) [Graph]. In Statista. Retrieved July 19, 2025, from https://www.statista.com/statistics/281968/food-chain-productivity-in-the-united-kingdom-uk-since-2000/
Defra, und GOV.UK. "Total factor productivity (TFP) trends of the whole food sector supply chain in the United Kingdom (UK) from 2000 to 2016 (index based)." Chart. January 25, 2018. Statista. Accessed July 19, 2025. https://www.statista.com/statistics/281968/food-chain-productivity-in-the-united-kingdom-uk-since-2000/
Defra, GOV.UK. (2018). Total factor productivity (TFP) trends of the whole food sector supply chain in the United Kingdom (UK) from 2000 to 2016 (index based). Statista. Statista Inc.. Accessed: July 19, 2025. https://www.statista.com/statistics/281968/food-chain-productivity-in-the-united-kingdom-uk-since-2000/
Defra, and GOV.UK. "Total Factor Productivity (Tfp) Trends of The Whole Food Sector Supply Chain in The United Kingdom (Uk) from 2000 to 2016 (Index Based)." Statista, Statista Inc., 25 Jan 2018, https://www.statista.com/statistics/281968/food-chain-productivity-in-the-united-kingdom-uk-since-2000/
Defra & GOV.UK, Total factor productivity (TFP) trends of the whole food sector supply chain in the United Kingdom (UK) from 2000 to 2016 (index based) Statista, https://www.statista.com/statistics/281968/food-chain-productivity-in-the-united-kingdom-uk-since-2000/ (last visited July 19, 2025)
Total factor productivity (TFP) trends of the whole food sector supply chain in the United Kingdom (UK) from 2000 to 2016 (index based) [Graph], Defra, & GOV.UK, January 25, 2018. [Online]. Available: https://www.statista.com/statistics/281968/food-chain-productivity-in-the-united-kingdom-uk-since-2000/
Advertisement
Profit from additional features with an Employee Account
Please create an employee account to be able to mark statistics as favorites.
Then you can access your favorite statistics via the star in the header.
Profit from the additional features of your individual account
Currently, you are using a shared account. To use individual functions (e.g., mark statistics as favourites, set
statistic alerts) please log in with your personal account.
If you are an admin, please authenticate by logging in again.