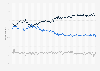
The value of goods exported from the United Kingdom was over 92.7 billion British pounds in the first quarter of 2025, compared with 151.9 billion pounds worth of goods imported, resulting in a goods trade deficit of around 59 billion pounds.
Value of trade in goods in the United Kingdom from 1st quarter 2000 to 1st quarter 2025
(in million GBP)
Characteristic
Exports
Imports
Balance
Q1 2025
92,746
151,901
-59,155
Q4 2024
86,421
148,180
-61,759
Q3 2024
91,884
144,554
-52,670
Q2 2024
92,269
156,322
-64,053
Q1 2024
95,083
142,554
-47,471
Q4 2023
98,316
147,229
-48,913
Q3 2023
95,020
145,112
-50,092
Q2 2023
99,292
153,521
-54,229
Q1 2023
102,773
158,136
-55,363
Q4 2022
121,579
157,863
-36,284
Q3 2022
119,960
165,887
-45,927
Q2 2022
100,710
161,175
-60,465
Q1 2022
91,874
155,734
-63,860
Q4 2021
93,303
130,591
-37,288
Q3 2021
79,326
127,017
-47,691
Q2 2021
84,829
119,872
-35,043
Q1 2021
74,677
116,860
-42,183
Q4 2020
81,884
131,201
-49,317
Q3 2020
75,129
109,358
-34,229
Q2 2020
72,984
87,094
-14,110
Q1 2020
83,753
114,102
-30,349
Q4 2019
99,504
119,688
-20,184
Q3 2019
92,977
127,321
-34,344
Q2 2019
85,417
123,489
-38,072
Q1 2019
90,305
142,702
-52,397
Q4 2018
88,219
126,973
-38,754
Q3 2018
91,196
125,108
-33,912
Q2 2018
88,848
122,835
-33,987
Q1 2018
85,741
120,378
-34,637
Q4 2017
85,398
119,616
-34,218
Q3 2017
85,008
121,804
-36,796
Q2 2017
85,790
120,242
-34,452
Q1 2017
83,729
118,085
-34,356
Q4 2016
80,397
114,679
-34,282
Q3 2016
74,422
114,742
-40,320
Q2 2016
74,830
107,038
-32,208
Q1 2016
69,749
102,270
-32,521
Q4 2015
69,038
100,940
-31,902
Q3 2015
68,713
99,326
-30,613
Q2 2015
73,208
100,922
-27,714
Q1 2015
69,945
105,034
-35,089
Q4 2014
72,026
109,831
-37,805
Q3 2014
70,924
104,895
-33,971
Q2 2014
73,649
102,835
-29,186
Q1 2014
72,574
102,734
-30,160
Q4 2013
73,368
107,775
-34,407
Q3 2013
76,106
107,016
-30,910
Q2 2013
75,357
107,406
-32,049
Q1 2013
74,899
102,496
-27,597
Q4 2012
73,173
101,025
-27,852
Q3 2012
74,389
102,827
-28,438
Q2 2012
72,588
103,667
-31,079
Q1 2012
78,281
103,515
-25,234
Q4 2011
77,397
102,714
-25,317
Q3 2011
74,274
103,905
-29,631
Q2 2011
74,376
102,943
-28,567
Q1 2011
76,522
97,022
-20,500
Q4 2010
69,577
96,935
-27,358
Q3 2010
66,685
93,287
-26,602
Q2 2010
66,695
90,080
-23,385
Q1 2010
62,939
84,998
-22,059
Q4 2009
60,952
82,679
-21,727
Q3 2009
56,707
79,205
-22,498
Q2 2009
54,587
76,806
-22,219
Q1 2009
55,705
78,517
-22,812
Q4 2008
59,759
83,002
-23,243
Q3 2008
66,681
90,556
-23,875
Q2 2008
65,272
90,525
-25,253
Q1 2008
60,881
84,548
-23,667
Q4 2007
58,044
82,165
-24,121
Q3 2007
55,553
80,748
-25,195
Q2 2007
55,652
76,878
-21,226
Q1 2007
53,576
76,600
-23,024
Q4 2006
54,144
75,345
-21,201
Q3 2006
55,621
77,212
-21,591
Q2 2006
70,049
89,403
-19,354
Q1 2006
66,604
86,719
-20,115
Q4 2005
56,841
75,911
-19,070
Q3 2005
54,569
73,726
-19,157
Q2 2005
52,255
70,069
-17,814
Q1 2005
48,829
66,833
-18,004
Q4 2004
50,236
67,462
-17,226
Q3 2004
48,424
65,355
-16,931
Q2 2004
46,662
63,547
-16,885
Q1 2004
45,740
62,049
-16,309
Q4 2003
47,124
63,004
-15,880
Q3 2003
46,075
60,614
-14,539
Q2 2003
46,413
60,228
-13,815
Q1 2003
48,271
61,332
-13,061
Q4 2002
44,213
59,797
-15,584
Q3 2002
46,769
60,414
-13,645
Q2 2002
49,219
62,282
-13,063
Q1 2002
47,258
59,513
-12,255
Q4 2001
45,772
57,844
-12,072
Q3 2001
46,316
58,808
-12,492
Q2 2001
48,115
61,067
-12,952
Q1 2001
50,479
61,595
-11,116
Q4 2000
49,078
59,972
-10,894
Q3 2000
46,614
57,843
-11,229
Q2 2000
46,172
55,296
-9,124
Q1 2000
44,960
53,528
-8,568
Zoomable Statistic: Select the range in the chart you want to zoom in on.
Profit from the additional features of your individual account
Currently, you are using a shared account. To use individual functions (e.g., mark statistics as favourites, set
statistic alerts) please log in with your personal account.
If you are an admin, please authenticate by logging in again.
Learn more about how Statista can support your business.
Office for National Statistics (UK). (May 15, 2025). Value of trade in goods in the United Kingdom from 1st quarter 2000 to 1st quarter 2025 (in million GBP) [Graph]. In Statista. Retrieved June 04, 2025, from https://www.statista.com/statistics/284738/uk-trade-in-goods/
Office for National Statistics (UK). "Value of trade in goods in the United Kingdom from 1st quarter 2000 to 1st quarter 2025 (in million GBP)." Chart. May 15, 2025. Statista. Accessed June 04, 2025. https://www.statista.com/statistics/284738/uk-trade-in-goods/
Office for National Statistics (UK). (2025). Value of trade in goods in the United Kingdom from 1st quarter 2000 to 1st quarter 2025 (in million GBP). Statista. Statista Inc.. Accessed: June 04, 2025. https://www.statista.com/statistics/284738/uk-trade-in-goods/
Office for National Statistics (UK). "Value of Trade in Goods in The United Kingdom from 1st Quarter 2000 to 1st Quarter 2025 (in Million Gbp)." Statista, Statista Inc., 15 May 2025, https://www.statista.com/statistics/284738/uk-trade-in-goods/
Office for National Statistics (UK), Value of trade in goods in the United Kingdom from 1st quarter 2000 to 1st quarter 2025 (in million GBP) Statista, https://www.statista.com/statistics/284738/uk-trade-in-goods/ (last visited June 04, 2025)
Value of trade in goods in the United Kingdom from 1st quarter 2000 to 1st quarter 2025 (in million GBP) [Graph], Office for National Statistics (UK), May 15, 2025. [Online]. Available: https://www.statista.com/statistics/284738/uk-trade-in-goods/