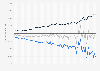
As of the first quarter of 2025, the value of goods exported to the European Union from the United Kingdom was over 42.1 billion British pounds, compared with around 76.7 billion pounds of goods imported, resulting in a negative goods trade balance with the EU of around approximately 34.6 billion pounds.
Advertisement
Advertisement
Value of trade in goods with the European Union in the United Kingdom from 1st quarter 2000 to 1st quarter 2025
(in million GBP)
Characteristic
Exports
Imports
Balance
Q1 2025
42,420
78,412
-35,992
Q4 2024
41,971
77,792
-35,821
Q3 2024
43,391
77,544
-34,153
Q2 2024
44,826
80,992
-36,166
Q1 2024
44,220
77,878
-33,658
Q4 2023
46,841
80,507
-33,666
Q3 2023
46,004
79,193
-33,189
Q2 2023
45,895
81,852
-35,957
Q1 2023
47,851
80,904
-33,053
Q4 2022
52,278
81,114
-28,836
Q3 2022
55,066
75,913
-20,847
Q2 2022
52,238
78,020
-25,782
Q1 2022
46,602
70,939
-24,337
Q4 2021
45,325
61,568
-16,243
Q3 2021
39,321
61,062
-21,741
Q2 2021
39,970
59,058
-19,088
Q1 2021
32,962
55,342
-22,380
Q4 2020
41,198
69,537
-28,339
Q3 2020
36,326
58,496
-22,170
Q2 2020
30,452
45,339
-14,887
Q1 2020
38,693
59,459
-20,766
Q4 2019
41,148
64,975
-23,827
Q3 2019
43,256
67,500
-24,244
Q2 2019
41,125
64,577
-23,452
Q1 2019
46,025
72,846
-26,821
Q4 2018
43,391
67,708
-24,317
Q3 2018
44,739
65,637
-20,898
Q2 2018
43,994
67,406
-23,412
Q1 2018
42,537
66,845
-24,308
Q4 2017
41,943
65,379
-23,436
Q3 2017
42,050
65,507
-23,457
Q2 2017
40,782
63,965
-23,183
Q1 2017
40,292
63,365
-23,073
Q4 2016
37,865
62,988
-25,123
Q3 2016
37,046
60,827
-23,781
Q2 2016
35,557
58,686
-23,129
Q1 2016
33,236
55,506
-22,270
Q4 2015
32,559
55,085
-22,526
Q3 2015
33,218
54,557
-21,339
Q2 2015
34,197
54,815
-20,618
Q1 2015
33,389
55,387
-21,998
Q4 2014
36,279
56,644
-20,365
Q3 2014
36,061
55,479
-19,418
Q2 2014
37,658
55,500
-17,842
Q1 2014
37,444
54,691
-17,247
Q4 2013
37,032
55,436
-18,404
Q3 2013
38,874
55,651
-16,777
Q2 2013
37,645
53,771
-16,126
Q1 2013
37,938
53,466
-15,528
Q4 2012
37,676
52,587
-14,911
Q3 2012
37,485
52,187
-14,702
Q2 2012
36,850
52,370
-15,520
Q1 2012
39,454
52,520
-13,066
Q4 2011
40,381
52,141
-11,760
Q3 2011
40,150
52,672
-12,522
Q2 2011
40,971
50,864
-9,893
Q1 2011
39,861
49,768
-9,907
Q4 2010
37,686
49,074
-11,388
Q3 2010
34,638
47,291
-12,653
Q2 2010
35,858
46,819
-10,961
Q1 2010
35,013
45,075
-10,062
Q4 2009
33,021
44,970
-11,949
Q3 2009
31,622
42,165
-10,543
Q2 2009
29,701
40,442
-10,741
Q1 2009
31,549
40,001
-8,452
Q4 2008
32,811
42,366
-9,555
Q3 2008
37,250
47,451
-10,201
Q2 2008
37,073
49,308
-12,235
Q1 2008
35,127
46,465
-11,338
Q4 2007
33,378
44,903
-11,525
Q3 2007
32,546
44,052
-11,506
Q2 2007
31,344
42,726
-11,382
Q1 2007
31,497
42,135
-10,638
Q4 2006
31,666
40,663
-8,997
Q3 2006
33,593
42,135
-8,542
Q2 2006
46,183
54,052
-7,869
Q1 2006
42,767
51,618
-8,851
Q4 2005
32,307
42,551
-10,244
Q3 2005
30,823
41,589
-10,766
Q2 2005
29,586
39,644
-10,058
Q1 2005
29,045
38,239
-9,194
Q4 2004
29,244
38,334
-9,090
Q3 2004
28,139
36,528
-8,389
Q2 2004
27,340
36,616
-9,276
Q1 2004
27,249
36,044
-8,795
Q4 2003
27,569
36,709
-9,140
Q3 2003
27,043
34,917
-7,874
Q2 2003
27,353
34,854
-7,501
Q1 2003
29,291
36,578
-7,287
Q4 2002
27,575
35,127
-7,552
Q3 2002
28,550
35,765
-7,215
Q2 2002
29,911
35,921
-6,010
Q1 2002
29,009
34,918
-5,909
Q4 2001
27,345
32,920
-5,575
Q3 2001
28,283
32,898
-4,615
Q2 2001
29,068
33,123
-4,055
Q1 2001
30,087
32,926
-2,839
Q4 2000
28,498
30,898
-2,400
Q3 2000
28,031
30,112
-2,081
Q2 2000
27,300
29,310
-2,010
Q1 2000
26,856
28,655
-1,799
Zoomable Statistic: Select the range in the chart you want to zoom in on.
Profit from the additional features of your individual account
Currently, you are using a shared account. To use individual functions (e.g., mark statistics as favourites, set
statistic alerts) please log in with your personal account.
If you are an admin, please authenticate by logging in again.
Learn more about how Statista can support your business.
Office for National Statistics (UK). (May 15, 2025). Value of trade in goods with the European Union in the United Kingdom from 1st quarter 2000 to 1st quarter 2025 (in million GBP) [Graph]. In Statista. Retrieved June 28, 2025, from https://www.statista.com/statistics/284750/united-kingdom-uk-total-eu-trade-in-goods-by-trade-value/
Office for National Statistics (UK). "Value of trade in goods with the European Union in the United Kingdom from 1st quarter 2000 to 1st quarter 2025 (in million GBP)." Chart. May 15, 2025. Statista. Accessed June 28, 2025. https://www.statista.com/statistics/284750/united-kingdom-uk-total-eu-trade-in-goods-by-trade-value/
Office for National Statistics (UK). (2025). Value of trade in goods with the European Union in the United Kingdom from 1st quarter 2000 to 1st quarter 2025 (in million GBP). Statista. Statista Inc.. Accessed: June 28, 2025. https://www.statista.com/statistics/284750/united-kingdom-uk-total-eu-trade-in-goods-by-trade-value/
Office for National Statistics (UK). "Value of Trade in Goods with The European Union in The United Kingdom from 1st Quarter 2000 to 1st Quarter 2025 (in Million Gbp)." Statista, Statista Inc., 15 May 2025, https://www.statista.com/statistics/284750/united-kingdom-uk-total-eu-trade-in-goods-by-trade-value/
Office for National Statistics (UK), Value of trade in goods with the European Union in the United Kingdom from 1st quarter 2000 to 1st quarter 2025 (in million GBP) Statista, https://www.statista.com/statistics/284750/united-kingdom-uk-total-eu-trade-in-goods-by-trade-value/ (last visited June 28, 2025)
Value of trade in goods with the European Union in the United Kingdom from 1st quarter 2000 to 1st quarter 2025 (in million GBP) [Graph], Office for National Statistics (UK), May 15, 2025. [Online]. Available: https://www.statista.com/statistics/284750/united-kingdom-uk-total-eu-trade-in-goods-by-trade-value/