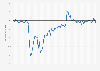
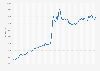
From March 2020 to onwards, internet sales in household goods compared to the same months in the previous year saw an unprecedented increase due to the impact of the coronavirus pandemic. However, sales fluctuated after February 2021 and registered a negative trend in February 2022, with a decrease of 39.1 percent. As of March 2025, another negative trend at -5.8 percent.
Advertisement
Advertisement
Percentage change in monthly internet household goods sales value in Great Britain from January 2018 to March 2025
Characteristic
Year-over-year percentage change*
2025-03
-5.8%
2025-02
-1.2%
2025-01
-6.9%
2024-12
-5.6%
2024-11
-15%
2024-10
-8%
2024-09
-8.9%
2024-08
-13.7%
2024-07
-15.2%
2024-06
-13.4%
2024-05
-10.9%
2024-04
-12.3%
2024-03
-8.7%
2024-02
-4.7%
2024-01
3.1%
2023-12
1.7%
2023-11
14.5%
2023-10
20.4%
2023-09
22.9%
2023-08
22%
2023-07
13.7%
2023-06
17.5%
2023-05
11.9%
2023-04
8.9%
2023-03
11.8%
2023-02
9.6%
2023-01
3.2%
2022-12
6.4%
2022-11
-5%
2022-10
-11.9%
2022-09
-10.5%
2022-08
-9.5%
2022-07
-4.8%
2022-06
-11.5%
2022-05
-15.7%
2022-04
-22.1%
2022-03
-33.7%
2022-02
-39.1%
2022-01
-28.8%
2021-12
9.1%
2021-11
-27.8%
2021-10
-8.6%
2021-09
2.5%
2021-08
1.3%
2021-07
9.6%
2021-06
-0.1%
2021-05
8.1%
2021-04
31.4%
2021-03
101.1%
2021-02
179.9%
2021-01
149.4%
2020-12
34.1%
2020-11
173.2%
2020-10
77.5%
2020-09
65.7%
2020-08
93.8%
2020-07
88.9%
2020-06
115.3%
2020-05
122.9%
2020-04
108.5%
2020-03
53.3%
2020-02
5.6%
2020-01
1.9%
2019-12
21.1%
2019-11
-9.4%
2019-10
13.2%
2019-09
10.4%
2019-08
2.1%
2019-07
9.4%
2019-06
16.1%
2019-05
14.3%
2019-04
13.3%
2019-03
-1.8%
2019-02
11.2%
2019-01
10.4%
2018-12
24.7%
2018-11
19.3%
2018-10
32.6%
2018-09
25.9%
2018-08
30.9%
2018-07
14.9%
2018-06
16.4%
2018-05
16.5%
2018-04
10.4%
2018-03
25.1%
2018-02
21%
2018-01
21.1%
Zoomable Statistic: Select the range in the chart you want to zoom in on.
Values are non-seasonally adjusted. Includes retail goods sales at "predominantly household goods stores." * Percent change on same month a year earlier.
Profit from the additional features of your individual account
Currently, you are using a shared account. To use individual functions (e.g., mark statistics as favourites, set
statistic alerts) please log in with your personal account.
If you are an admin, please authenticate by logging in again.
Learn more about how Statista can support your business.
Office for National Statistics (UK). (April 25, 2025). Percentage change in monthly internet household goods sales value in Great Britain from January 2018 to March 2025 [Graph]. In Statista. Retrieved June 17, 2025, from https://www.statista.com/statistics/286373/internet-household-goods-sales-value-trend-monthly-in-the-united-kingdom-uk/
Office for National Statistics (UK). "Percentage change in monthly internet household goods sales value in Great Britain from January 2018 to March 2025." Chart. April 25, 2025. Statista. Accessed June 17, 2025. https://www.statista.com/statistics/286373/internet-household-goods-sales-value-trend-monthly-in-the-united-kingdom-uk/
Office for National Statistics (UK). (2025). Percentage change in monthly internet household goods sales value in Great Britain from January 2018 to March 2025. Statista. Statista Inc.. Accessed: June 17, 2025. https://www.statista.com/statistics/286373/internet-household-goods-sales-value-trend-monthly-in-the-united-kingdom-uk/
Office for National Statistics (UK). "Percentage Change in Monthly Internet Household Goods Sales Value in Great Britain from January 2018 to March 2025." Statista, Statista Inc., 25 Apr 2025, https://www.statista.com/statistics/286373/internet-household-goods-sales-value-trend-monthly-in-the-united-kingdom-uk/
Office for National Statistics (UK), Percentage change in monthly internet household goods sales value in Great Britain from January 2018 to March 2025 Statista, https://www.statista.com/statistics/286373/internet-household-goods-sales-value-trend-monthly-in-the-united-kingdom-uk/ (last visited June 17, 2025)
Percentage change in monthly internet household goods sales value in Great Britain from January 2018 to March 2025 [Graph], Office for National Statistics (UK), April 25, 2025. [Online]. Available: https://www.statista.com/statistics/286373/internet-household-goods-sales-value-trend-monthly-in-the-united-kingdom-uk/