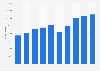
The statistic shows the sales volume of footwear and leather goods in Great Britain from 2008 to 2022, as an index number of sales per week. Over the time period in consideration, volume of sales of footwear and leather goods has generally increased, but in 2020 it decreased significantly an dropped to an index value of 81.3. As of 2022, footwear and leather goods sales volume stood at an index value of 103.2.
Advertisement
Advertisement
Sales volume of footwear and leather goods in Great Britain from 2008 to 2022, as index number of sales per week
Figures are seasonally adjusted, chained volume of sales in predominantly non-food stores (textile, clothing and footwear stores). Index 2019 = 100 (reference period).
Profit from the additional features of your individual account
Currently, you are using a shared account. To use individual functions (e.g., mark statistics as favourites, set
statistic alerts) please log in with your personal account.
If you are an admin, please authenticate by logging in again.
Learn more about how Statista can support your business.
Office for National Statistics (UK). (May 26, 2023). Sales volume of footwear and leather goods in Great Britain from 2008 to 2022, as index number of sales per week [Graph]. In Statista. Retrieved July 03, 2025, from https://www.statista.com/statistics/287035/annual-footwear-leather-goods-retail-sales-volume-index-in-great-britain/
Office for National Statistics (UK). "Sales volume of footwear and leather goods in Great Britain from 2008 to 2022, as index number of sales per week." Chart. May 26, 2023. Statista. Accessed July 03, 2025. https://www.statista.com/statistics/287035/annual-footwear-leather-goods-retail-sales-volume-index-in-great-britain/
Office for National Statistics (UK). (2023). Sales volume of footwear and leather goods in Great Britain from 2008 to 2022, as index number of sales per week. Statista. Statista Inc.. Accessed: July 03, 2025. https://www.statista.com/statistics/287035/annual-footwear-leather-goods-retail-sales-volume-index-in-great-britain/
Office for National Statistics (UK). "Sales Volume of Footwear and Leather Goods in Great Britain from 2008 to 2022, as Index Number of Sales per Week." Statista, Statista Inc., 26 May 2023, https://www.statista.com/statistics/287035/annual-footwear-leather-goods-retail-sales-volume-index-in-great-britain/
Office for National Statistics (UK), Sales volume of footwear and leather goods in Great Britain from 2008 to 2022, as index number of sales per week Statista, https://www.statista.com/statistics/287035/annual-footwear-leather-goods-retail-sales-volume-index-in-great-britain/ (last visited July 03, 2025)
Sales volume of footwear and leather goods in Great Britain from 2008 to 2022, as index number of sales per week [Graph], Office for National Statistics (UK), May 26, 2023. [Online]. Available: https://www.statista.com/statistics/287035/annual-footwear-leather-goods-retail-sales-volume-index-in-great-britain/