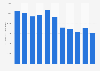
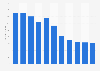
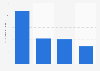
This statistic shows the amount spent (sales value) in non-specialized, predominantly non-food stores (e.g. department stores) monthly in Great Britain from January 2016 to December 2024, as an index of sales per week. Retail sales in department and similar stores had a substantial decrease in April and May 2020, and again in January 2021 as a result of coronavirus pandemic. As of December 2024, department store sales value index stood at 108.3 points.
Advertisement
Advertisement
Value of sales in non-specialized predominantly non-food stores in Great Britain from January 2016 to December 2024, by index number of sales per week
Profit from the additional features of your individual account
Currently, you are using a shared account. To use individual functions (e.g., mark statistics as favourites, set
statistic alerts) please log in with your personal account.
If you are an admin, please authenticate by logging in again.
Learn more about how Statista can support your business.
Office for National Statistics (UK). (January 17, 2025). Value of sales in non-specialized predominantly non-food stores in Great Britain from January 2016 to December 2024, by index number of sales per week [Graph]. In Statista. Retrieved June 28, 2025, from https://www.statista.com/statistics/287308/monthly-non-specialised-department-store-retail-sales-value-index-in-great-britain/
Office for National Statistics (UK). "Value of sales in non-specialized predominantly non-food stores in Great Britain from January 2016 to December 2024, by index number of sales per week." Chart. January 17, 2025. Statista. Accessed June 28, 2025. https://www.statista.com/statistics/287308/monthly-non-specialised-department-store-retail-sales-value-index-in-great-britain/
Office for National Statistics (UK). (2025). Value of sales in non-specialized predominantly non-food stores in Great Britain from January 2016 to December 2024, by index number of sales per week. Statista. Statista Inc.. Accessed: June 28, 2025. https://www.statista.com/statistics/287308/monthly-non-specialised-department-store-retail-sales-value-index-in-great-britain/
Office for National Statistics (UK). "Value of Sales in Non-specialized Predominantly Non-food Stores in Great Britain from January 2016 to December 2024, by Index Number of Sales per Week." Statista, Statista Inc., 17 Jan 2025, https://www.statista.com/statistics/287308/monthly-non-specialised-department-store-retail-sales-value-index-in-great-britain/
Office for National Statistics (UK), Value of sales in non-specialized predominantly non-food stores in Great Britain from January 2016 to December 2024, by index number of sales per week Statista, https://www.statista.com/statistics/287308/monthly-non-specialised-department-store-retail-sales-value-index-in-great-britain/ (last visited June 28, 2025)
Value of sales in non-specialized predominantly non-food stores in Great Britain from January 2016 to December 2024, by index number of sales per week [Graph], Office for National Statistics (UK), January 17, 2025. [Online]. Available: https://www.statista.com/statistics/287308/monthly-non-specialised-department-store-retail-sales-value-index-in-great-britain/