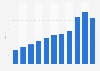
This statistic shows total annual sales for all retailing in Great Britain, expressed as a weekly average from 2005 to 2023. Since 2010, average weekly retail sales have shown an increase year on year except for 2020, where the retail sales had a slight decrease. Figures began to increase again in 2021, but decreased slightly in 2022 and 2023. In 2023, approximately 98.3 billion British pounds worth of sales per week were made across all retail sectors.
Advertisement
Advertisement
Average weekly retail sales in Great Britain (UK) from 2005 to 2023, based on volume
(in million GBP)
Profit from the additional features of your individual account
Currently, you are using a shared account. To use individual functions (e.g., mark statistics as favourites, set
statistic alerts) please log in with your personal account.
If you are an admin, please authenticate by logging in again.
Learn more about how Statista can support your business.
Office for National Statistics (UK). (August 16, 2024). Average weekly retail sales in Great Britain (UK) from 2005 to 2023, based on volume (in million GBP) [Graph]. In Statista. Retrieved June 20, 2025, from https://www.statista.com/statistics/287981/average-weekly-retail-sales-value-in-great-britain-year-to-year/
Office for National Statistics (UK). "Average weekly retail sales in Great Britain (UK) from 2005 to 2023, based on volume (in million GBP)." Chart. August 16, 2024. Statista. Accessed June 20, 2025. https://www.statista.com/statistics/287981/average-weekly-retail-sales-value-in-great-britain-year-to-year/
Office for National Statistics (UK). (2024). Average weekly retail sales in Great Britain (UK) from 2005 to 2023, based on volume (in million GBP). Statista. Statista Inc.. Accessed: June 20, 2025. https://www.statista.com/statistics/287981/average-weekly-retail-sales-value-in-great-britain-year-to-year/
Office for National Statistics (UK). "Average Weekly Retail Sales in Great Britain (Uk) from 2005 to 2023, Based on Volume (in Million Gbp)." Statista, Statista Inc., 16 Aug 2024, https://www.statista.com/statistics/287981/average-weekly-retail-sales-value-in-great-britain-year-to-year/
Office for National Statistics (UK), Average weekly retail sales in Great Britain (UK) from 2005 to 2023, based on volume (in million GBP) Statista, https://www.statista.com/statistics/287981/average-weekly-retail-sales-value-in-great-britain-year-to-year/ (last visited June 20, 2025)
Average weekly retail sales in Great Britain (UK) from 2005 to 2023, based on volume (in million GBP) [Graph], Office for National Statistics (UK), August 16, 2024. [Online]. Available: https://www.statista.com/statistics/287981/average-weekly-retail-sales-value-in-great-britain-year-to-year/