The revenue generated by British Telecommunications Business segment (BT Business) in the fourth quarter of the fiscal year 2021/22, ending March 31, 2022, from Republic of Ireland was approximately 71 million British pounds. According to the source, this was a 7.8 percent decrease compared to the same quarter in the previous year.
Advertisement
Advertisement
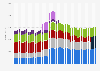
Revenues of BT Enterprise from 1st quarter of 2014/15 to 4th quarter of 2021/22, by type of service
(in million GBP)
Characteristic
Other (incl eliminations)
Public sector & Major Business (ex RoI)
Corporate
SME
Republic of Ireland
Managed services
Fixed
Mobile
Q4 2021
130
-
-
-
71
300
533
256
Q3 2021
130
-
-
-
73
250
542
300
Q2 2021
116
-
-
-
68
261
550
290
Q1 2021
108
-
-
-
72
261
559
287
Q4 2020
122
-
-
-
77
308
563
293
Q3 2020
123
-
-
-
81
282
580
310
Q2 2020
119
-
-
-
74
273
592
300
Q1 2020
110
-
-
-
80
278
598
286
Q4 2019
72
-
-
-
78
305
630
322
Q3 2019
129
-
-
-
81
293
630
325
Q2 2019
170
-
-
-
85
281
643
325
Q1 2019
161
-
-
-
81
289
643
309
Q4 2018
-
409
153
398
86
297
-
-
05001,0001,500-5002,000
Add this content to your personal favorites. These can be accessed from the favorites menu in the main navigation.
You have no right to use this feature.
Make sure to contact us if you are interested in scientific citation.
You can upgrade your account to enable this functionality for all statistics.
This feature is not available with your current account.Request access
Learn more about how Statista can support your business.
BT. (May 12, 2022). Revenues of BT Enterprise from 1st quarter of 2014/15 to 4th quarter of 2021/22, by type of service (in million GBP) [Graph]. In Statista. Retrieved June 27, 2025, from https://www.statista.com/statistics/290264/bt-business-revenues-by-type-of-service/
BT. "Revenues of BT Enterprise from 1st quarter of 2014/15 to 4th quarter of 2021/22, by type of service (in million GBP)." Chart. May 12, 2022. Statista. Accessed June 27, 2025. https://www.statista.com/statistics/290264/bt-business-revenues-by-type-of-service/
BT. (2022). Revenues of BT Enterprise from 1st quarter of 2014/15 to 4th quarter of 2021/22, by type of service (in million GBP). Statista. Statista Inc.. Accessed: June 27, 2025. https://www.statista.com/statistics/290264/bt-business-revenues-by-type-of-service/
BT. "Revenues of Bt Enterprise from 1st Quarter of 2014/15 to 4th Quarter of 2021/22, by Type of Service (in Million Gbp)." Statista, Statista Inc., 12 May 2022, https://www.statista.com/statistics/290264/bt-business-revenues-by-type-of-service/
BT, Revenues of BT Enterprise from 1st quarter of 2014/15 to 4th quarter of 2021/22, by type of service (in million GBP) Statista, https://www.statista.com/statistics/290264/bt-business-revenues-by-type-of-service/ (last visited June 27, 2025)
Revenues of BT Enterprise from 1st quarter of 2014/15 to 4th quarter of 2021/22, by type of service (in million GBP) [Graph], BT, May 12, 2022. [Online]. Available: https://www.statista.com/statistics/290264/bt-business-revenues-by-type-of-service/
Advertisement
Profit from additional features with an Employee Account
Please create an employee account to be able to mark statistics as favorites.
Then you can access your favorite statistics via the star in the header.
Profit from the additional features of your individual account
Currently, you are using a shared account. To use individual functions (e.g., mark statistics as favourites, set
statistic alerts) please log in with your personal account.
If you are an admin, please authenticate by logging in again.