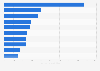
This statistic shows the revenue of pharmaceutical company AstraZeneca by therapy area in 2022 and 2023. In 2023, revenue in the area of oncology amounted to over 17 billion U.S. dollars. AstraZeneca plc is a leading pharmaceutical company, headquartered in London, UK. AstraZeneca is focused on products for the following major disease areas: cancer, cardiovascular, gastrointestinal, infection, neuroscience, respiratory and inflammation.
Revenue of AstraZeneca from 2022 to 2024, by therapy area
(in million U.S. dollars)
Characteristic
2022
2023
2024
Oncology
14,631
17,145
20,275
Cardiovascular, renal and metabolic diseases
9,188
10,585
12,448
Rare diseases
7,053
7,764
8,668
Respiratory & immunology
5,765
6,107
7,416
Vaccines & immune therapies
4,736
1,012
1,058
Other disease areas
1,625
1,176
1,073
05,00010,00015,00020,00025,000
Add this content to your personal favorites. These can be accessed from the favorites menu in the main navigation.
You have no right to use this feature.
Make sure to contact us if you are interested in scientific citation.
You can upgrade your account to enable this functionality for all statistics.
This feature is not available with your current account.Request access
Learn more about how Statista can support your business.
AstraZeneca, & U.S. Securities and Exchange Commission. (February 17, 2025). Revenue of AstraZeneca from 2022 to 2024, by therapy area (in million U.S. dollars) [Graph]. In Statista. Retrieved May 12, 2025, from https://www.statista.com/statistics/293056/astrazeneca-revenue-by-therapeutic-area/
AstraZeneca, und U.S. Securities and Exchange Commission. "Revenue of AstraZeneca from 2022 to 2024, by therapy area (in million U.S. dollars)." Chart. February 17, 2025. Statista. Accessed May 12, 2025. https://www.statista.com/statistics/293056/astrazeneca-revenue-by-therapeutic-area/
AstraZeneca, U.S. Securities and Exchange Commission. (2025). Revenue of AstraZeneca from 2022 to 2024, by therapy area (in million U.S. dollars). Statista. Statista Inc.. Accessed: May 12, 2025. https://www.statista.com/statistics/293056/astrazeneca-revenue-by-therapeutic-area/
AstraZeneca, and U.S. Securities and Exchange Commission. "Revenue of Astrazeneca from 2022 to 2024, by Therapy Area (in Million U.S. Dollars)." Statista, Statista Inc., 17 Feb 2025, https://www.statista.com/statistics/293056/astrazeneca-revenue-by-therapeutic-area/
AstraZeneca & U.S. Securities and Exchange Commission, Revenue of AstraZeneca from 2022 to 2024, by therapy area (in million U.S. dollars) Statista, https://www.statista.com/statistics/293056/astrazeneca-revenue-by-therapeutic-area/ (last visited May 12, 2025)
Revenue of AstraZeneca from 2022 to 2024, by therapy area (in million U.S. dollars) [Graph], AstraZeneca, & U.S. Securities and Exchange Commission, February 17, 2025. [Online]. Available: https://www.statista.com/statistics/293056/astrazeneca-revenue-by-therapeutic-area/
Profit from additional features with an Employee Account
Please create an employee account to be able to mark statistics as favorites.
Then you can access your favorite statistics via the star in the header.
Profit from the additional features of your individual account
Currently, you are using a shared account. To use individual functions (e.g., mark statistics as favourites, set
statistic alerts) please log in with your personal account.
If you are an admin, please authenticate by logging in again.